CarMax 2014 Annual Report Download - page 43
Download and view the complete annual report
Please find page 43 of the 2014 CarMax annual report below. You can navigate through the pages in the report by either clicking on the pages listed below, or by using the keyword search tool below to find specific information within the annual report.-
 1
1 -
2
-
3
-
4
-
5
-
6
-
7
-
8
-
9
-
10
-
11
-
12
-
13
-
14
-
15
-
16
-
17
-
18
-
19
-
20
-
21
-
22
-
23
-
24
-
25
-
26
-
27
-
28
-
29
-
30
-
31
-
32
-
 33
33 -
 34
34 -
 35
35 -
 36
36 -
 37
37 -
 38
38 -
 39
39 -
 40
40 -
 41
41 -
 42
42 -
 43
43 -
 44
44 -
 45
45 -
 46
46 -
 47
47 -
 48
48 -
 49
49 -
 50
50 -
 51
51 -
 52
52 -
 53
53 -
54
-
55
-
56
-
57
-
58
-
59
-
60
-
61
-
62
-
63
-
64
-
65
-
66
-
67
-
68
-
69
-
70
-
71
-
72
-
73
-
74
-
75
-
76
-
77
-
78
-
79
-
80
-
81
-
82
-
83
-
84
-
85
-
86
-
87
-
88
-
89
-
90
-
91
-
92
 |
 |

39
Item 7A. Quantitative and Qualitative Disclosures about Market Risk.
Auto Loan Receivables
As of February 28, 2014 and 2013, all loans in our portfolio of managed receivables were fixed-rate installment
contracts. Financing for these receivables was achieved through cash flow or asset securitization programs that, in
turn, issued both fixed- and floating-rate securities. Our derivative instruments are used to manage differences in the
amount of our known or expected cash receipts and our known or expected cash payments principally related to the
funding of our auto loan receivables. Disruptions in the credit markets could impact the effectiveness of our
hedging strategies. Other receivables are financed with working capital. Generally, changes in interest rates
associated with underlying swaps will not have a material impact on earnings; however, they could have a material
impact on cash and cash flows.
Credit risk is the exposure to nonperformance of another party to an agreement. We mitigate credit risk by dealing
with highly rated bank counterparties. The market and credit risks associated with derivative instruments are similar
to those relating to other types of financial instruments. See Notes 5 and 6 for additional information on derivative
instruments and hedging activities.
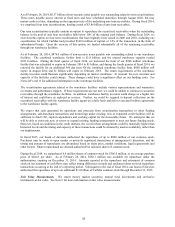
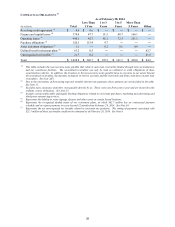
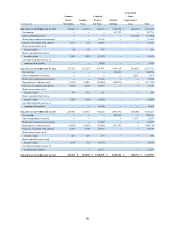
COMPOSITION OF AUTO LOAN RECEIVABLES
As of February 28
(In millions) 2014 2013
Principal amount of:
Fixed-rate securitizations $ 6,145.5 $ 4,989.7
Floating-rate securitizations (1) 879.0 792.0
Other receivables (2) 159.9 151.6
Total $ 7,184.4 $ 5,933.3
(1) We have entered into derivatives designated as cash flow hedges of forecasted interest payments in anticipation of
permanent funding for these receivables in the term securitization market. The current notional amount of these derivatives
was $869.0 million as of February 28, 2014, and $750.0 million as of February 28, 2013. See Note 5.
(2) Other receivables include receivables not funded through the warehouse facilities.
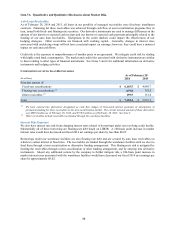
Interest Rate Exposure
We also have interest rate risk from changing interest rates related to borrowings under our revolving credit facility.
Substantially all of these borrowing are floating-rate debt based on LIBOR. A 100-basis point increase in market
interest rates would have decreased our fiscal 2014 net earnings per share by less than $0.01.
Borrowings under our warehouse facilities are also floating rate debt and are secured by auto loan receivables on
which we collect interest at fixed rates. The receivables are funded through the warehouse facilities until we elect to
fund them through a term securitization or alternative funding arrangement. This floating-rate risk is mitigated by
funding the receivables through a term securitization or other funding arrangement, and by entering into derivative
instruments. Absent any additional actions by the company to further mitigate risk, a 100-basis point increase in
market interest rates associated with the warehouse facilities would have decreased our fiscal 2014 net earnings per
share by approximately $0.02.