CarMax 2014 Annual Report Download - page 58
Download and view the complete annual report
Please find page 58 of the 2014 CarMax annual report below. You can navigate through the pages in the report by either clicking on the pages listed below, or by using the keyword search tool below to find specific information within the annual report.-
 1
1 -
2
-
3
-
4
-
5
-
6
-
7
-
8
-
9
-
10
-
11
-
12
-
13
-
14
-
15
-
16
-
17
-
18
-
19
-
20
-
21
-
22
-
23
-
24
-
25
-
26
-
27
-
28
-
29
-
30
-
31
-
32
-
33
-
34
-
35
-
36
-
37
-
38
-
39
-
40
-
41
-
42
-
43
-
44
-
45
-
46
-
47
-
 48
48 -
 49
49 -
 50
50 -
 51
51 -
 52
52 -
 53
53 -
 54
54 -
 55
55 -
 56
56 -
 57
57 -
 58
58 -
 59
59 -
 60
60 -
 61
61 -
 62
62 -
 63
63 -
 64
64 -
 65
65 -
 66
66 -
 67
67 -
 68
68 -
69
-
70
-
71
-
72
-
73
-
74
-
75
-
76
-
77
-
78
-
79
-
80
-
81
-
82
-
83
-
84
-
85
-
86
-
87
-
88
-
89
-
90
-
91
-
92
 |
 |
54
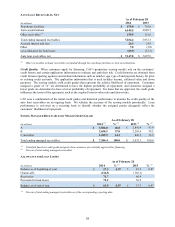
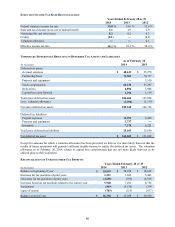
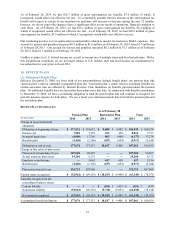
AUTO LOAN RECEIVABLES, NET
As of February 28
(In millions) 2014 2013
Warehouse facilities $ 879.0 $ 792.0
Term securitizations 6,145.5 4,989.7
Other receivables (1) 159.9 151.6
Total ending managed receivables 7,184.4 5,933.3
Accrued interest and fees 26.3 24.9
Other 7.0 (5.0)
Less allowance for loan losses (69.9) (57.3)
Auto loan receivables, net $ 7,147.8 $ 5,895.9
(1) Other receivables includes receivables not funded through the warehouse facilities or term securitizations.
Credit Quality. When customers apply for financing, CAF’s proprietary scoring models rely on the customers’
credit history and certain application information to evaluate and rank their risk. Credit histories are obtained from
credit bureau reporting agencies and include information such as number, age, type of and payment history for prior
or existing credit accounts. The application information that is used includes income, collateral value and down
payment. The scoring models yield credit grades that represent the relative likelihood of repayment. Customers
assigned a grade of “A” are determined to have the highest probability of repayment, and customers assigned a
lower grade are determined to have a lower probability of repayment. For loans that are approved, the credit grade
influences the terms of the agreement, such as the required loan-to-value ratio and interest rate.
CAF uses a combination of the initial credit grades and historical performance to monitor the credit quality of the
auto loan receivables on an ongoing basis. We validate the accuracy of the scoring models periodically. Loan
performance is reviewed on a recurring basis to identify whether the assigned grades adequately reflect the
customers’ likelihood of repayment.
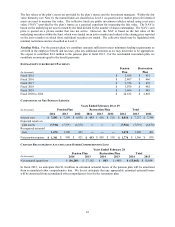
ENDING MANAGED RECEIVABLES BY MAJOR CREDIT GRADE
As of February 28
(In millions) 2014 (1) % (2) 2013 (1) % (2)
A $ 3,506.0 48.8 $ 2,841.4 47.9
B 2,658.5 37.0 2,265.6 38.2
C and other 1,019.9 14.2 826.3 13.9
Total ending managed receivables $ 7,184.4 100.0 $ 5,933.3 100.0
(1) Classified based on credit grade assigned when customers were initially approved for financing.
(2) Percent of total ending managed receivables.
ALLOWANCE FOR LOAN LOSSES
As of February 28
(In millions)
2014 % (1) 2013 % (1)
Balance as of beginning of year $ 57.3 0.97 $ 43.3 0.87
Charge-offs (134.3) (103.1)
Recoveries 74.7 60.9
Provision for loan losses 72.2 56.2
Balance as of end of year $ 69.9 0.97 $ 57.3 0.97
(1) Percent of total ending managed receivables as of the corresponding reporting date.