CarMax 2014 Annual Report Download - page 37
Download and view the complete annual report
Please find page 37 of the 2014 CarMax annual report below. You can navigate through the pages in the report by either clicking on the pages listed below, or by using the keyword search tool below to find specific information within the annual report.-
 1
1 -
2
-
3
-
4
-
5
-
6
-
7
-
8
-
9
-
10
-
11
-
12
-
13
-
14
-
15
-
16
-
17
-
18
-
19
-
20
-
21
-
22
-
23
-
24
-
25
-
26
-
 27
27 -
 28
28 -
 29
29 -
 30
30 -
 31
31 -
 32
32 -
 33
33 -
 34
34 -
 35
35 -
 36
36 -
 37
37 -
 38
38 -
 39
39 -
 40
40 -
 41
41 -
 42
42 -
 43
43 -
 44
44 -
 45
45 -
 46
46 -
 47
47 -
48
-
49
-
50
-
51
-
52
-
53
-
54
-
55
-
56
-
57
-
58
-
59
-
60
-
61
-
62
-
63
-
64
-
65
-
66
-
67
-
68
-
69
-
70
-
71
-
72
-
73
-
74
-
75
-
76
-
77
-
78
-
79
-
80
-
81
-
82
-
83
-
84
-
85
-
86
-
87
-
88
-
89
-
90
-
91
-
92
 |
 |

33
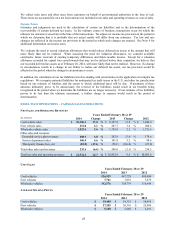
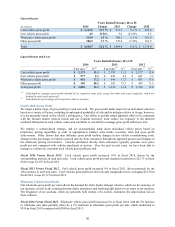
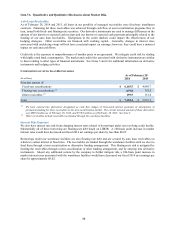
CAF ORIGINATION INFORMATION
Years Ended February 28 or 29 (1)
2014 2013 2012
N
et loans originated (in millions) $ 4,183.9 $ 3,445.3 $ 2,842.9
Vehicle units financed 218,706 179,525 152,468
Penetration rate (2) 40.9 % 39.4 %
36.7 %
Weighted average contract rate 7.0 % 7.9 %
8.8 %
Weighted average term (in months) 65.4 65.9 65.3
(1) All information relates to loans originated net of 3-day payoffs and vehicle returns.
(2) Vehicle units financed as a percentage of total retail units sold.
Fiscal 2014 Versus Fiscal 2013. CAF income increased 12% to $336.2 million from $299.3 million in fiscal 2013.
The improvement resulted from the growth in CAF’s managed receivables, partially offset by a lower total interest
margin rate.
CAF’s average managed receivables increased 23% to $6.63 billion in fiscal 2014, driven by the growth in CAF net
loan originations, which rose 21% to $4.18 billion. Origination volumes benefited from an increase in CAF’s loan
penetration rate, which grew steadily from its recent low of 30% in fiscal 2011 to 41% in fiscal 2014, and the growth
in the company’s retail unit sales. The improvement in the loan penetration rate over this period reflected a
combination of factors, including a transition back to CAF’s pre-recession origination strategy during fiscal 2012
and favorable responses to changes in our credit offers. The transition back to CAF’s pre-recession origination
strategy reduced the volume of finance contracts we had been selling to third-party providers. In mid-fiscal 2013,
we began strategically providing more competitive offers. See Note 4 for additional information on the credit
quality of CAF’s auto loan receivables.
Total interest margin, which reflects the spread between interest and fees charged to consumers and our funding
costs, declined to 6.9% of average managed receivables in fiscal 2014 compared with 7.4% in fiscal 2013.
Strategically providing more competitive offers contributed to a decline in the weighted average contract rate on
loan originations to 7.0% in fiscal 2014 from 7.9% in fiscal 2013. Changes in the interest margin on new
originations affect CAF income over time as these loans come to represent an increasing percentage of managed
receivables. Rising interest rates, which affect CAF’s funding costs, or further competitive pressures on consumer
rates could result in further compression in the interest margin on new originations.
The provision for loan losses is the periodic expense of maintaining an adequate allowance. In fiscal 2014, the
provision for loan losses as a percentage of average managed receivables increased slightly to 1.09% from 1.04% in
fiscal 2013.
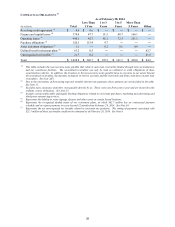
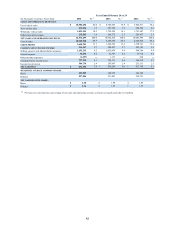
ALLOWANCE FOR LOAN LOSSES
Years Ended February 28 or 29
(In millions) 2014 % (1) 2013 % (1)
Balance as of beginning of year $57.3 0.97 $ 43.3 0.87
Charge-offs (134.3) (103.1)
Recoveries 74.7 60.9
Provision for loan losses 72.2 56.2
Balance as of end of year $69.9 0.97 $ 57.3 0.97
(1) Percent of total ending managed receivables as of the corresponding reporting date.
The allowance for loan losses represents an estimate of the amount of net losses inherent in our portfolio of managed
receivables as of the applicable reporting date and anticipated to occur during the following 12 months. The
allowance is primarily based on the credit quality of the underlying receivables, historical loss trends and forecasted
forward loss curves. We consider recent trends in delinquencies and losses, recovery rates and the economic
environment in determining the adequacy of the allowance. The increase in the dollar amount of the allowance
largely reflected the growth in managed receivables. The allowance for loan losses as a percent of managed
receivables was flat at 0.97% as of both February 28, 2014, and February 28, 2013.