CarMax 2014 Annual Report Download - page 36
Download and view the complete annual report
Please find page 36 of the 2014 CarMax annual report below. You can navigate through the pages in the report by either clicking on the pages listed below, or by using the keyword search tool below to find specific information within the annual report.-
 1
1 -
2
-
3
-
4
-
5
-
6
-
7
-
8
-
9
-
10
-
11
-
12
-
13
-
14
-
15
-
16
-
17
-
18
-
19
-
20
-
21
-
22
-
23
-
24
-
25
-
 26
26 -
 27
27 -
 28
28 -
 29
29 -
 30
30 -
 31
31 -
 32
32 -
 33
33 -
 34
34 -
 35
35 -
 36
36 -
 37
37 -
 38
38 -
 39
39 -
 40
40 -
 41
41 -
 42
42 -
 43
43 -
 44
44 -
 45
45 -
 46
46 -
47
-
48
-
49
-
50
-
51
-
52
-
53
-
54
-
55
-
56
-
57
-
58
-
59
-
60
-
61
-
62
-
63
-
64
-
65
-
66
-
67
-
68
-
69
-
70
-
71
-
72
-
73
-
74
-
75
-
76
-
77
-
78
-
79
-
80
-
81
-
82
-
83
-
84
-
85
-
86
-
87
-
88
-
89
-
90
-
91
-
92
 |
 |

32
Fiscal 2013 Versus Fiscal 2012. SG&A expenses increased 10% in fiscal 2013. The increase primarily reflected
the combination of the 9% expansion in our store base during fiscal 2013 (representing the addition of 10 stores),
higher variable selling costs resulting from the 5% increase in comparable store used unit sales, and higher growth-
related costs. Growth-related costs include store pre-opening expenses, relocation expenses, and the costs of
maintaining store management bench strength to support future growth. Growth-related costs were affected by the
increase in the rate of our store openings, from 5 stores in fiscal 2012 to 10 stores in fiscal 2013. SG&A per retail
unit was consistent at $2,263 in both fiscal 2013 and fiscal 2012.
Income Taxes
The effective income tax rate was 38.2 % in fiscal 2014, 38.1% in fiscal 2013 and 38.0% in fiscal 2012.
RESULTS OF OPERATIONS – CARMAX AUTO FINANCE
CAF provides financing to qualified customers purchasing vehicles at CarMax. Because the purchase of a vehicle is
generally reliant on the consumer’s ability to obtain on-the-spot financing, it is important to our business that
financing be available to creditworthy customers. While financing can also be obtained from third-party sources, we
believe that total reliance on third parties can create unacceptable volatility and business risk. Furthermore, we
believe the company’s processes and systems, transparency of pricing, vehicle quality and the integrity of the
information collected at the time the customer applies for credit provide a unique and ideal environment in which to
procure high quality auto loans, both for CAF and for the third-party finance providers.
We believe CAF enables us to capture additional sales, profits and cash flows while managing our reliance on third-
party finance sources. Management regularly analyzes CAF's operating results by assessing the competitiveness of
our consumer offer, profitability, the performance of the auto loan receivables including trends in credit losses and
delinquencies, and CAF direct expenses.
CAF income primarily reflects the interest and fee income generated by the auto loan receivables less the interest
expense associated with the debt issued to fund these receivables, a provision for estimated loan losses and direct
CAF expenses. CAF income does not include any allocation of indirect costs. While CAF benefits from certain
indirect overhead expenditures, we have elected to present this information on a direct basis to avoid making arbitrary
decisions regarding the indirect benefits or costs that could be attributed to CAF. Examples of indirect costs not
allocated to CAF include retail store expenses and corporate expenses such as human resources, administrative
services, marketing, information systems, accounting, legal, treasury and executive payroll.
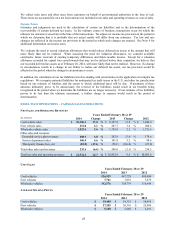
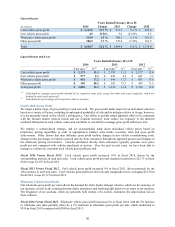
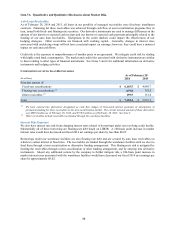
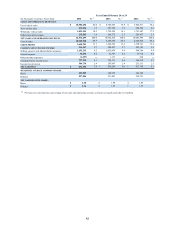
COMPONENTS OF CAF INCOME
Years Ended February 28 or 29
(In millions) 2014 % (1) 2013 % (1) 2012 % (1)
Interest margin:
Interest and fee income $548.0 8.3
$ 495.3 9.2 $ 448.7 9.6
Interest expense (90.0) (1.4) (95.1) (1.8) (106.1) (2.3)
Total interest margin 458.0 6.9 400.2 7.4 342.6 7.3
Provision for loan losses (72.2) (1.1) (56.2) (1.0) (36.4) (0.8)
Total interest margin after
provision for loan losses 385.8 5.8 344.0 6.4 306.2 6.6
Other income 0.1 ― ― ― 1.5 ―
Direct expenses:
Payroll and fringe benefit expense (22.6) (0.3) (21.2) (0.4) (20.7) (0.4)
Other direct expenses (27.1) (0.4) (23.5) (0.4) (24.8) (0.5)
Total direct expenses (49.7) (0.8) (44.7) (0.8) (45.5) (1.0)
CarMax Auto Finance income $336.2 5.1 $299.3 5.6 $ 262.2 5.6
Total average managed receivables $ 6,629.5 $ 5,385.5 $ 4,662.4
(1) Percent of total average managed receivables.