CVS 2001 Annual Report Download - page 32
Download and view the complete annual report
Please find page 32 of the 2001 CVS annual report below. You can navigate through the pages in the report by either clicking on the pages listed below, or by using the keyword search tool below to find specific information within the annual report.-
 1
1 -
2
-
3
-
4
-
5
-
6
-
7
-
8
-
9
-
10
-
11
-
12
-
13
-
14
-
15
-
16
-
17
-
18
-
19
-
20
-
21
-
 22
22 -
 23
23 -
 24
24 -
 25
25 -
 26
26 -
 27
27 -
 28
28 -
 29
29 -
 30
30 -
 31
31 -
 32
32 -
 33
33 -
 34
34 -
 35
35 -
 36
36
 |
 |

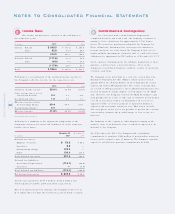
Notes to Consolidated Financial Statements
CVS Corporation
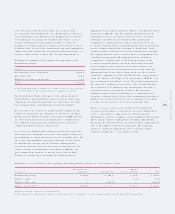
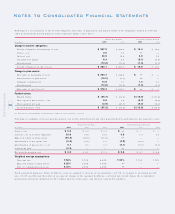
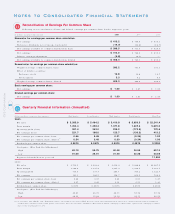
Reconciliation of Earnings Per Common Share
Fo llo wing is a reco nciliatio n o f basic and diluted earnings per co mmo n share fo r the respective years:
In millions, e xce pt pe r share amounts 200 1 2000 1999
Numerat or for earnings per common share calculation:
Net earnings $ 413 .2 $ 746.0 $ 635.1
Preference dividends, net of inc o me tax benefit ( 14.7) ( 14. 6) ( 14. 7)
Net earnings available to co mmo n shareho lders, basic $ 3 98.5 $ 731.4 $ 620.4
Net earnings $ 413 .2 $ 746.0 $ 635.1
Dilutive earnings adjustment ( 4.8) ( 0.7) —
Net earnings available to co mmo n shareho lders, diluted $ 408 .4 $ 745.3 $ 635.1
Denominator for earnings per common share calculation:
Weighted average co mmo n shares, basic 392.2 391.0 391.3
Effect o f dilutive sec urities:
Preference sto ck 10.8 10.8 10.7
Stoc k o ptio ns 5.3 6.2 6.9
Weighted average co mmo n shares, diluted 408.3 408.0 408.9
Basic earnings per common share:
Net earnings $ 1.02 $ 1.87 $ 1.59
Diluted earnings per common share:
Net earnings $ 1.00 $ 1.83 $ 1.55
11
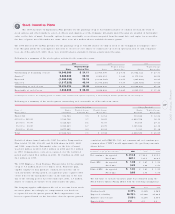
Do llars in millio ns, e xce pt pe r share amo unts First Quarter Sec o nd Quarter Third Quarter Fo urth Quarter Fisc al Year
2001:
Net sales $ 5,385.9 $ 5,494.2 $ 5,410.8 $ 5,950.5 $ 22,241.4
Gro ss margin 1,453.4 1,458.4 1,371.8 1,407.4 5,691.0
Operating pro fit ( lo ss) 381.4 342.0 220.2 (173.0) 770.6
Net earnings ( loss) 221.7 198.0 123.7 (130.2) 413.2
Net earnings per co mmo n share, basic 0.56 0.49 0 .31 ( 0.3 4 ) 1.02
Net earnings per co mmo n share, diluted ( 1 ) 0 .54 0.4 8 0.30 ( 0 .34 ) 1.0 0
Dividends per co mmo n share 0.0575 0.0575 0.0575 0.0575 0.2300
Stoc k price: ( New Yo rk Stoc k Exchange)
Hig h 62.10 59.75 40.48 34.55 62.10
Lo w 51.00 36.51 31.40 23.28 23.28
Registered shareho lders at year-end 11,000
2000:
Net sales $ 4,739.5 $ 4,942.8 $ 4,916.4 $ 5,488.8 $ 20,087.5
Gro ss margin 1,300.0 1,335.8 1,297. 4 1,428.5 5,361.7
Operating pro fit 334.9 333.9 284.7 369.2 1,322.7
Net earnings 191.3 186.5 158.7 209.5 746.0
Net earnings per co mmo n share, basic 0.48 0.47 0.40 0.53 1.87
Net earnings per co mmo n share, diluted 0.47 0.46 0.39 0.51 1.83
Dividends per co mmo n share 0.0575 0.0575 0.0575 0.0575 0.2300
Stoc k price: ( New Yo rk Stoc k Exchange)
Hig h 40.63 46.75 46.31 59.94 59.94
Lo w 28. 00 3 5. 88 3 4. 38 44 .3 1 28.00
( 1) In accordance with SFAS No . 128 , “Earnings per Share”, the assumed conversio n o f ESOP preferenc e sto c k and o utstanding sto ck o ptio ns were excluded fro m the diluted earnings per
co mmo n share c alculatio n in the fo urth quarter o f 2001 since their effect wo uld be antidilutive. This results in diluted earnings per commo n share e qual to basic earnings per co mmo n
share fo r the fo urth quarter o f 2001.
Quarterly Financial I nformation ( Unaudit ed)
12
30