CVS 2001 Annual Report Download - page 29
Download and view the complete annual report
Please find page 29 of the 2001 CVS annual report below. You can navigate through the pages in the report by either clicking on the pages listed below, or by using the keyword search tool below to find specific information within the annual report.-
 1
1 -
2
-
3
-
4
-
5
-
6
-
7
-
8
-
9
-
10
-
11
-
12
-
13
-
14
-
15
-
16
-
17
-
18
-
 19
19 -
 20
20 -
 21
21 -
 22
22 -
 23
23 -
 24
24 -
 25
25 -
 26
26 -
 27
27 -
 28
28 -
 29
29 -
 30
30 -
 31
31 -
 32
32 -
 33
33 -
 34
34 -
 35
35 -
 36
36
 |
 |

27
2001 Annual Report
St ock I ncentive Plans
The 1997 Incentive Co mpensatio n Plan pro vides fo r the g ranting o f up to 42.9 millio n shares of co mmo n sto ck in the fo rm o f
sto ck o ptio ns and o ther awards to selected officers and emplo yees of the Co mpany. All grants under the plan are awarded at fair market
value on the date of g rant. Generally, o ptio ns become exercisable o ver a fo ur- year perio d from the grant date and expire ten years after
the date of grant. As of December 29, 2001, there were 27.3 million shares available fo r future grants.
The 1996 Directors Sto ck Plan pro vides fo r the granting of up to 346,460 shares o f c o mmo n stoc k to the Co mpany’s nonemplo yee direc-
to rs. The plan allo ws the no nemplo yee directors to elect to receive shares of c o mmo n stoc k o r sto c k optio ns in lieu of cash co mpensa-
tion. As of December 29, 2001, there were 204,005 shares available fo r future g rants under the plan.
Restricted shares issued under the 1997 Incentive Co mpensatio n
Plan to taled 76,164, 952,251 and 59,908 shares in 2001, 2000
and 1999, respectively. Fair market value o n the date of g rant
was $4.6 million in 2001, $29.1 millio n in 2000 and $3.1 millio n
in 1999. Co mpensatio n co sts are reco g nized o ver the restricted
perio d and to taled $5.4 millio n in 2001, $5.9 millio n in 2000 and
$2.3 millio n in 1999.
The 1999 Emplo yee Sto ck Purchase Plan pro vides fo r the granting
of up to 7.4 millio n shares of c o mmo n stoc k. Under the plan,
eligible emplo yees may purchase co mmo n sto ck at the end of
each six- mo nth o ffering perio d, at a purchase price equal to 85%
of the lo wer o f the fair market value o n the first day o r the last
day o f the offering perio d. As o f December 29, 2001, 1.7 million
shares o f c o mmo n stoc k have been issued under the plan.
The Co mpany applies APB Opinion No . 25 to acco unt fo r its sto ck
inc entive plans. Acco rdingly, no co mpensatio n co st has been
reco g nized fo r sto ck options granted. Had co mpensatio n co st
been reco gnized based o n the fair value o f sto ck options granted
co nsistent with SFAS No. 123, net earnings and net earning s per
co mmo n share ( “EPS”) wo uld approximate the pro fo rma amo unts
sho wn below:
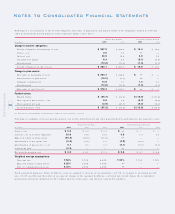
The fair value of each stock o ptio n grant was estimated using the
Black-Scho les Optio n Pricing Mo del with the fo llo wing assumptio ns:
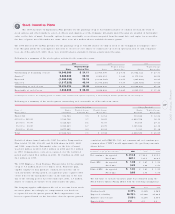
Fo llo wing is a summary o f the sto c k optio n activity fo r the respective years:
200 1 2000 1999
Weight ed Average Weighted Average Weighted Average
Shares Exercise Price Shares Exercise Price Shares Exercise Price
Outstanding at beginning of year 14,646,990 $ 31.11 12,964,600 $ 27.38 11,982,122 $ 23.31
Grante d ( 1) 5,380,520 59.55 6,964, 015 33.84 2,175,342 48.02
Exercised ( 1,083,533 ) 23.13 ( 3,51 0, 785) 19 .5 5 ( 927 ,0 80) 18.87
Canceled ( 1,317 ,25 3 ) 43.14 ( 1,770 ,8 40) 37. 37 ( 265 ,7 84) 37. 65
Outstanding at end o f year 17,626,724 39.48 14,646,990 31.11 12,964,600 27.38
Exercisable at end o f year 4,608,595 $ 25.09 4,048,842 $ 18.85 6,065,351 $ 17.92
( 1) During 2001 and 2000, the Company granted 3.0 millio n and 5.1 millio n sto ck o ptio ns, respective ly, to substantially all full-time pharmac ists and sto re managers.
Fo llo wing is a summary o f the sto c k optio ns o utstanding and exerc isable as o f December 29, 2001:
Optio ns Outstanding Optio ns Exercisable
Range o f Numbe r Weighted Average We ighted Ave rage Number Weighted Average
Exercise Prices Outstanding Remaining Life Exercise Price Exercisable Exercise Price
Under $15 314,984 3.5 $ 12.54 314,846 $ 12.54
$15.01 to $25.00 3,184,768 3.7 18.65 2,864,758 18.16
25.01 to 35.00 4,328,424 8.1 31.75 45,814 29.11
35.01 to 50.00 4,920,863 6.7 40.70 1,381,844 42.16
50.01 to 61.23 4,877,685 9.0 60.44 1,333 51.38
To tal 17, 62 6, 724 7. 1 $ 3 9. 48 4 ,6 08,595 $ 2 5. 09
In millions, e xce pt pe r share amounts 2 00 1 2000 1999
Net earnings: As repo rted $ 413 .2 $ 746.0 $ 635.1
Pro fo rma 357.1 717.7 614.7
Basic EPS: As repo rted $ 1.02 $ 1.87 $ 1.59
Pro fo rma 0.87 1.80 1.53
Diluted EPS: As repo rted $ 1.0 0 $ 1.83 $ 1.55
Pro fo rma 0.86 1.76 1.50
200 1 2000 1999
Dividend yie ld 0.77% 0.40% 0.58%
Expected vo latility 29.79% 27.92% 25.86%
Risk-free interest rate 5.00% 6. 25% 6.50%
Expected life 7.0 6.5 6.0
7