CVS 2001 Annual Report Download - page 21
Download and view the complete annual report
Please find page 21 of the 2001 CVS annual report below. You can navigate through the pages in the report by either clicking on the pages listed below, or by using the keyword search tool below to find specific information within the annual report.-
 1
1 -
2
-
3
-
4
-
5
-
6
-
7
-
8
-
9
-
10
-
 11
11 -
 12
12 -
 13
13 -
 14
14 -
 15
15 -
 16
16 -
 17
17 -
 18
18 -
 19
19 -
 20
20 -
 21
21 -
 22
22 -
 23
23 -
 24
24 -
 25
25 -
 26
26 -
 27
27 -
 28
28 -
 29
29 -
 30
30 -
 31
31 -
32
-
33
-
34
-
35
-
36
 |
 |

19
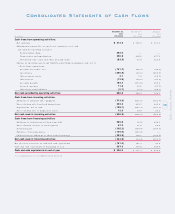
Consolidated Statements of Cash Flows
2001 Annual Report
December 2 9 , Dec ember 30, January 1,
200 1 2000 2000
In millions ( 5 2 weeks) (52 weeks) ( 53 weeks)
Cash flows from operati ng activities:
Net earnings $ 413 .2 $ 746.0 $ 635.1
Adjustments required to reconcile net earnings to net cash
pro vided by o perating activities:
Restructuring charge 352.5 — —
Depreciatio n and amo rtizatio n 320.8 296.6 277.9
Deferred inco me taxes and o ther no ncash items ( 83.5) 43.8 124.8
Change in operating assets and liabilities pro viding/ ( requiring) c ash, net of
effects fro m acquisitio ns:
Acc o unts receivable, net (141.7) ( 86.7) ( 48. 9)
Inve nto ries (366.8) ( 98.1) ( 255. 0)
Other current assets 4.1 7. 0 ( 1 6. 7)
Other assets ( 13.9) ( 50. 1) ( 97. 9)
Acc o unts payable 184.4 ( 133. 6) 166 .8
Acc rued expenses 11.6 59. 6 ( 3 7. 7)
Other lo ng- term liabilities ( 0.1) ( 4. 3) ( 22. 1)
Net cash provided by operating acti vit ies 680 .6 780.2 726.3
Cash flows from investing activities:
Additio ns to pro perty and equipment (713.6) ( 695. 3) ( 722. 7)
Pro ceeds fro m sale-leaseback transactio ns 323.3 299.3 229.2
Acquisitio ns, net of cash (159.1) ( 263. 3) ( 101. 1)
Pro ceeds fro m sale o r dispo sal of assets 12.6 18.8 28.2
Net cash used in investing activities ( 536 .8) ( 640 .5 ) ( 566 .4 )
Cash flows from financing activit i es:
Additio ns to ( reductio ns in) lo ng- term debt 295.9 ( 0.9) 298 .1
Pro ceeds fro m exercise of sto ck o ptio ns 47.3 97.8 20.4
Dividends paid (105.2) ( 104.8) ( 104. 7)
Purchase of treasury shares (129.0) ( 163. 2) —
( Reductio ns in) additio ns to sho rt-term bo rrowings (353.8) 138. 7 ( 324. 5)
Net cash used in f inancing activities ( 244 .8) ( 32.4) ( 110. 7)
Net ( decrease) increase in cash and cash equivalents (101.0) 107.3 49.2
Cash and cash equivalents at beginning of year 337.3 230.0 180.8
Cash and cash equivalents at end of year $ 23 6.3 $ 337.3 $ 230.0
See ac co mpanying no tes to conso lidated financ ial statements.