CVS 2001 Annual Report Download - page 16
Download and view the complete annual report
Please find page 16 of the 2001 CVS annual report below. You can navigate through the pages in the report by either clicking on the pages listed below, or by using the keyword search tool below to find specific information within the annual report.-
 1
1 -
2
-
3
-
4
-
5
-
 6
6 -
 7
7 -
 8
8 -
 9
9 -
 10
10 -
 11
11 -
 12
12 -
 13
13 -
 14
14 -
 15
15 -
 16
16 -
 17
17 -
 18
18 -
 19
19 -
 20
20 -
 21
21 -
 22
22 -
 23
23 -
 24
24 -
 25
25 -
 26
26 -
27
-
28
-
29
-
30
-
31
-
32
-
33
-
34
-
35
-
36
 |
 |

CVS Corporation
14
The decrease in interest expense in 2001 was due to a
co mbinatio n o f lo wer average interest rates and lower average
borrowing levels during 2001 co mpared to 2000. The increase in
interest expense in 2000 was due to a co mbinatio n o f higher
average interest rates and higher average borro wing levels during
2000 co mpared to 1999.
I ncome tax provision ~ Our effective inco me tax rate was 41.8%
in 2001, 40.0% in 2000 and 41.0% in 1999. Our effective inco me
tax rate was higher in 2001 because certain co mpo nents o f the
Restructuring Charge were no t deductible fo r inco me tax
purpo ses. The decrease in o ur effective inco me tax rate in 2000
was primarily due to lo wer state inco me taxes. Excluding the
impact o f the Restructuring Charge, o ur effective inco me tax rate
was 39.4% in 2001.
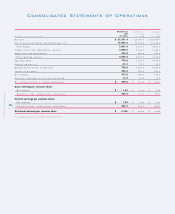
Net earnings decreased $332.8 millio n to $413.2 millio n ( o r
$1.00 per diluted share) in 2001. This co mpares to $746.0
millio n ( o r $1.83 per diluted share) in 2000 and $635.1 millio n
( o r $1.55 per diluted share) in 1999. If yo u exclude the effect o f
the Restructuring Charge and the $2.1 millio n net no nrecurring
gain ( o r $0.56 per diluted share) in 2001 and the $11. 5 millio n
litigatio n gain ( o r $0.03 per diluted share) in 2000, o ur
co mparable net earnings decreased $92.9 millio n to $641. 6
millio n ( o r $1.56 per diluted share) in 2001. This compares to
$734.5 millio n ( o r $1.80 per diluted share) in 2000 and $635.1
millio n ( o r $1.55 per diluted share) in 1999.
Liquidit y & Capital Resources
We fund the gro wth o f o ur business through a co mbinatio n o f
cash flo w fro m o peratio ns, co mmercial paper and long- term
borrowings. Our liquidity is no t currently dependent o n the use o f
off- balance sheet transactio ns o ther than no rmal operating leases.
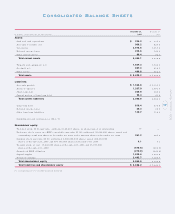
We had $235.8 millio n o f co mmercial paper o utstanding at a
weighted average interest rate o f 2.1% as of December 29, 2001.
In c o nnection with o ur co mmercial paper pro gram, we maintain a
$650 millio n, five- year unsecured bac k-up credit facility, which
expires o n May 30, 2006 and a $650 millio n, 364- day unsecured
bac k-up credit facility, which expires on May 30, 2002. We
currently expec t to replace the 364-day facility with a similar
facility during 2002. The credit facilities allo w fo r bo rro wings at
vario us rates depending o n o ur public debt rating. As o f December
29, 2001, we had no t bo rro wed against the credit facilities.
During 2001, we issued $300 millio n of 5.625% unsecured senio r
notes. The notes are due March 15, 2006 and pay interest semi-
annually. We may redeem these no tes at any time, in who le or in
part, at a defined redemptio n pric e plus accrued interest. Net
pro ceeds from the no tes were used to repay o utstanding
co mmercial paper.
Our credit facilities and unsecured senio r notes co ntain custo mary
restrictive financial and o perating co venants. We do no t believe
that the restrictio ns co ntained in the co venants materially affec t
o ur financial o r o perating flexibility.
Our liquidity is based, in part, o n maintaining strong investment-
grade debt ratings. During 2001, o ur debt ratings were upgraded
by Mo o dy’s to ‘A2’ fo r long- term debt and ‘P-1’ fo r co mmercial
paper, while Standard and Po o r’s affirmed o ur ‘A’ rating fo r lo ng-
term debt and ‘A- 1’ fo r co mmercial paper. We do no t currently
fo resee any reaso nable circumstances under which we wo uld lo se
o ur investment- grade debt ratings. Ho wever, if this were to o c cur,
it co uld adversely impact, amo ng o ther things, o ur future
borrowing co sts, ac cess to capital markets and new sto re
o perating lease co sts.
We believe that o ur cash o n hand, cash pro vided by o peratio ns,
o ur co mmercial paper program and o ur ability to o btain
alternative so urces o f financing should be sufficient to c o ver o ur
working capital needs, capital expenditures and debt service
requirements fo r at least the next twelve months and beyo nd.
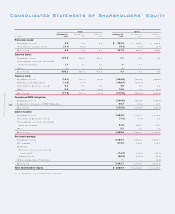
On March 6, 2000, the Bo ard of Directo rs appro ved a co mmo n
sto ck repurchase pro g ram, which allo ws the Co mpany to acquire
up to $1 billio n o f its co mmo n sto c k, in part, to fund emplo yee
benefit plans. During 2001, we repurchased 3.4 millio n shares at
an aggregate co st o f $129. 0 millio n. Since inceptio n of the
pro gram, we repurc hased 8.1 millio n shares at an aggregate c o st
of $292.2 million.
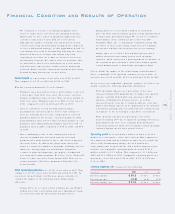
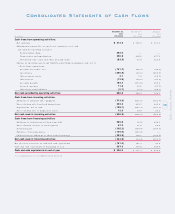
Net cash provided by operating acti vit ies decreased to $680.6
millio n in 2001. This co mpares to $780.2 millio n in 2000 and
$726.3 millio n in 1999. The decline in net cash pro vided by
o peratio ns was primarily the result o f lo wer net earnings. Cash
pro vided by o perating activities will be neg atively impac ted by
future payments asso c iated with the Restructuring Charge. The
timing of future cash payments related to the Restructuring
Charge depend o n when, and if, early lease terminatio ns can be
reac hed. We currently anticipate that a majo rity o f the lease
o bligatio ns will be settled during 2002. As o f December 29, 2001,
the remaining payments, which primarily co nsist o f no ncancelable
lease o blig atio ns extending thro ugh 2024, to taled $244.8 millio n.
Net cash used in investing activities decreased to $536.8
millio n in 2001. This co mpares to $640.5 millio n in 2000 and
$566.4 millio n in 1999. The decline in net cash used in investing
activities was primarily due to reduced acquisitio n activity.
Additio ns to pro perty and equipment totaled $713.6 millio n
during 2001. This co mpares to $695. 3 million in 2000 and $722.7
millio n in 1999. During 2001 we o pened 126 new sto res,
relo cated 122 sto res and clo sed 68 sto res. New sto re develo pment
inc luded 43 sto res in new markets, including: Miami and Ft.
Lauderdale, Flo rida; Las Vegas, Nevada; and Dallas, Ho usto n and
Fo rt Wo rth, Texas. During 2002 we pro jec t appro ximately 150-175
new sto res, including 75 in new markets, 100 relo catio ns and 50
sto re clo sings in additio n to the Restructuring Charge sto re
clo sings. As of December 29, 2001, we o perated 4,191 retail and
specialty pharmacy sto res in 33 states and the District o f
Co lumbia. This c o mpares to 4,133 sto res as of December 30, 2000.
Management’s Discussion and Analysis of