CVS 2001 Annual Report Download - page 28
Download and view the complete annual report
Please find page 28 of the 2001 CVS annual report below. You can navigate through the pages in the report by either clicking on the pages listed below, or by using the keyword search tool below to find specific information within the annual report.-
 1
1 -
2
-
3
-
4
-
5
-
6
-
7
-
8
-
9
-
10
-
11
-
12
-
13
-
14
-
15
-
16
-
17
-
 18
18 -
 19
19 -
 20
20 -
 21
21 -
 22
22 -
 23
23 -
 24
24 -
 25
25 -
 26
26 -
 27
27 -
 28
28 -
 29
29 -
 30
30 -
 31
31 -
 32
32 -
 33
33 -
 34
34 -
 35
35 -
 36
36
 |
 |

CVS Corporation
26
Notes to Consolidated Financial Statements
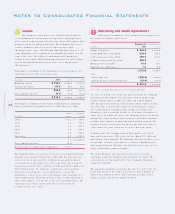
Fo llo wing is a reco nciliatio n o f the benefit o bligatio n, fair value o f plan assets and funded status o f the Co mpany’s defined benefit and
o ther po stretirement benefit plans as of the respective balance sheet dates:
Defined Benefit Plans Other Postretirement Benefits
In millions 200 1 2000 20 01 2000
Change in benef it obligat i on:
Benefit o bligatio n at beginning o f year $ 267 .2 $ 254.8 $ 13.4 $ 14.0
Service co st 0.5 0.9 ——
Interest co st 20.9 19.8 0 .9 1.0
Actuarial lo ss ( gain) 9.3 9.6 ( 0 .1 ) ( 0 .5 )
Benefits paid ( 14.8) ( 17. 9) ( 1.3) ( 1.1)
Benefit o bligatio n at end o f year $ 283 .1 $ 267.2 $ 12.9 $ 13.4
Change in plan asset s:
Fair value at beginning o f year $ 234.7 $ 248.8 $ — $—
Actual return on plan assets ( 16.0) ( 3. 3) ——
Co mpany co ntributions 14.5 7.1 1.3 1.1
Benefits paid ( 14.8) ( 17. 9) ( 1.3) ( 1.1)
Fair value at end o f year( 1) $ 218 .4 $ 234.7 $ — $—
Funded stat us:
Funded status $ ( 6 4.7) $ ( 3 2. 5) $ ( 12 .9) $ ( 13.4)
Unreco g nized prio r service co st 0 .9 1.0 ( 0.7) ( 0.8)
Unreco g nized net gain ( 3.5) ( 27 .7 ) ( 0.3) ( 0.4)
Acc rued pensio n co sts $ ( 6 7.3) $ ( 5 9. 2) $ ( 13 .9) $ ( 14.6)
( 1) Plan assets co nsist primarily of mutual funds, co mmo n sto ck and insurance co ntracts.
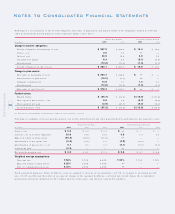
Fo llo wing is a summary o f the net perio dic pension co st fo r the defined benefit and o ther postretirement benefit plans fo r the respective years:
Defined Benefit Plans Other Po stretirement Benefits
In millions 200 1 2000 1999 2001 2000 1999
Service co st $ 0.5 $ 0.9 $ 0.7 $ — $—$—
Interest co st o n benefit o bligatio n 20.9 19.8 19.8 0.9 1.0 0.9
Expected return o n plan assets ( 2 0.2) ( 1 8. 6) ( 1 6. 6) —— —
Amo rtizatio n of net ( gain) lo ss ( 0.3) ( 0.1) 1 .3 ( 0.2 ) ( 0. 2) —
Amo rtizatio n of prio r service co st 0.1 0.1 0.1 ( 0.1) ( 0. 1) ( 0 .1 )
Settlement gain ( 0.2)— ——— —
Net perio dic pension co st $ 0.8 $ 2.1 $ 5.3 $ 0 .6 $ 0.7 $ 0.8
Wei ghted average assumpt ions:
Disc o unt rate 7.50% 7.75% 8.00% 7.25% 7.75% 7.75%
Expected return o n plan assets 9.25% 9.25% 9.00% —— —
Rate of co mpensatio n increase 4.00% 4.00% 4.00% —— —
Fo r measurement purposes, future healthcare co sts are assumed to increase at an annual rate of 9.0% , decreasing to an annual gro wth
rate of 5.0% in 2006 and thereafter. A o ne percent change in the assumed healthcare co st trend rate wo uld change the accumulated
po stretirement benefit obligatio n by $0.7 millio n and the total service and interest co sts by $0.1 millio n.