CVS 2001 Annual Report Download - page 15
Download and view the complete annual report
Please find page 15 of the 2001 CVS annual report below. You can navigate through the pages in the report by either clicking on the pages listed below, or by using the keyword search tool below to find specific information within the annual report.-
 1
1 -
2
-
3
-
4
-
 5
5 -
 6
6 -
 7
7 -
 8
8 -
 9
9 -
 10
10 -
 11
11 -
 12
12 -
 13
13 -
 14
14 -
 15
15 -
 16
16 -
 17
17 -
 18
18 -
 19
19 -
 20
20 -
 21
21 -
 22
22 -
 23
23 -
 24
24 -
 25
25 -
26
-
27
-
28
-
29
-
30
-
31
-
32
-
33
-
34
-
35
-
36
 |
 |

13
2001 Annual Report
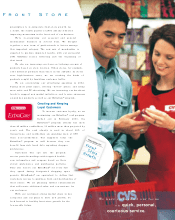
•We co ntinued to relo cate o ur existing sho pping center
sto res to larger, mo re co nvenient, freestanding locatio ns.
Histo rically, we have achieved significant impro vement in
custo mer count and net sales fro m sto re relo cations.
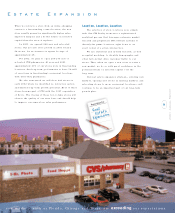
Altho ugh the number of annual relo catio ns has decreased,
o ur relo catio n strategy will remain an impo rtant co mpo nent
of o ur o verall gro wth strateg y, as o nly appro ximately 43% of
o ur existing sto res will be freestanding fo llo wing the abo ve-
mentio ned 229 sto re clo sings. Our current lo ng-term
expec tatio n is to have 70 to 80% of o ur sto res lo cated in
freestanding lo c atio ns. We canno t, ho wever, guarantee that
we will achieve this level o r that future sto re relo catio ns
will deliver the same po sitive results as tho se histo rically
achieved. Please read the “Cautio nary Statement Co ncerning
Fo rward-Lo o king Statements” sectio n belo w.
Gross margin as a percentage of net sales was 25.6% in 2001.
This co mpares to 26.7% in 2000 and 26.9% in 1999.
Why has o ur gro ss margin rate been declining?
•Pharmacy sales grew and we believe will co ntinue to gro w at
a faster pace than fro nt sto re sales. On average, o ur gro ss
margin o n pharmacy sales is lo wer than o ur gross margin o n
fro nt sto re sales. Pharmacy sales were 66% of to tal sales in
2001, co mpared to 63% in 2000 and 59% in 1999.
•Sales to c usto mers co vered by third party insuranc e
pro grams have increased and we believe will co ntinue to
inc rease, and thus have bec o me a larger part o f o ur to tal
pharmacy business. On average, o ur gro ss margin o n third
party pharmacy sales is lo wer than o ur gro ss margin o n cash
pharmacy sales. Third party prescriptio n sales were 91% of
pharmacy sales in 2001, co mpared to 89% in 2000 and 87%
in 1999.
•Also co ntributing to the decline during 2001 was an
inc rease in markdo wns asso ciated with the increased
pro mo tional activity discussed abo ve and elevated physical
inventory lo sses. To address the physical invento ry lo ss
trend, we initiated a number of pro grams, including, but no t
limited to , mo ving high- co st merc handise behind the
co unter o r g lass and impro ving o ur employee backgro und
screening and testing pro grams. We believe these effo rts will
begin to reduce invento ry lo sses during 2002. Ho wever, we
canno t guarantee that these prog rams will pro duce the
desired results.
Tot al operat i ng expenses were 22.1% o f net sales in 2001. This
co mpares to 20.1% o f net sales in 2000 and 20.6% in 1999. As
you review o ur performance in this area, please remember to
co nsider the impact of the follo wing nonrecurring c harge
and gains:
•During 2001, we reco rded a $346. 8 millio n pre-tax ( $226.9
millio n after-tax) restructuring and asset impairment charge
in co nnectio n with the Action Plan discussed abo ve.
•During 2001, we received $50.3 millio n of settlement
pro ceeds from vario us lawsuits against certain manufacturers
of brand name prescriptio n drugs. We elected to co ntribute
$46.8 millio n o f the settlement pro c eeds to the CVS
Charitable Trust, Inc. to fund future charitable giving. The
net effect of these nonrecurring items was a $3.5 millio n
pre-tax ( $2.1 millio n after-tax) increase in net earnings.
•
During 2000, we reco rded a $19.2 millio n pre- tax ( $11.5
millio n after-tax) no nrecurring g ain in to tal o perating
expenses, which represented a partial payment o f o ur share o f
the settlement proceeds fro m a class actio n lawsuit against
certain manufacturers o f brand name prescriptio n drugs.
If yo u exclude the impact of the no nrecurring items discussed
abo ve, co mparable to tal o perating expenses as a percentage of
net sales were 20.6% in 2001, 20.2% in 2000 and 20.6% in 1999.
As yo u review o ur comparable o perating expenses, we believe yo u
sho uld co nsider the fo llo wing important info rmation:
•To tal o perating expenses as a perc entage o f net sales
inc reased during 2001 primarily due to higher sto re payro ll
expense resulting fro m market wage pressures and the
sho rtage of pharmacists disc ussed abo ve, as well as
inc reased benefit costs due to rising healthcare co sts and
hig her advertising expense as we implemented our custo mer
reac tivatio n pro gram aimed at attracting lo st c usto mers and
in respo nse to the increasingly co mpetitive enviro nment.
•
To tal o perating expenses as a percentage of net sales
decreased during 2000 due to impro ved o perating efficiencies,
particularly at the sto re level, resulting fro m info rmatio n
techno log y initiatives and better leveraging of fixed o perating
expenses against o ur net sales growth in 2000.
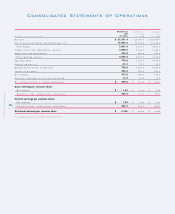
Operat ing profit decreased $552.1 millio n in 2001 to $770.6
millio n as a co nsequence of the above facto rs. This co mpares to
$1.3 billio n in 2000 and $1.1 billio n in 1999. If yo u exc lude the
effect of the Restructuring Charge, the $3.5 millio n net
nonrecurring g ain in 2001 and the $19.2 millio n litigatio n gain
in 2000, o ur co mparable o perating profit decreased $183. 9
millio n in 2001 to $1.1 billio n. This co mpares to $1.3 billio n in
2000 and $1.1 billio n in 1999. Co mparable o perating profit as a
percentage of net sales was 5. 0% in 2001, 6.5% in 2000 and
6.3% in 1999.
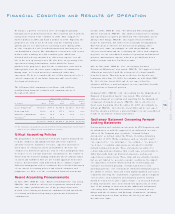
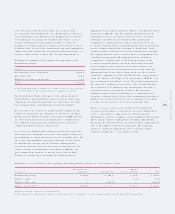
I nt erest expense, net co nsisted o f the fo llo wing:
In millions 200 1 2000 1999
Interest expense $ 65.2 $ 84.1 $ 66.1
Interest inco me ( 4.2) ( 4.8) ( 7.0)
Interest expense, net $ 6 1.0 $ 79.3 $ 59.1
Financial Condition and Results of Operation