CVS 1999 Annual Report Download - page 38
Download and view the complete annual report
Please find page 38 of the 1999 CVS annual report below. You can navigate through the pages in the report by either clicking on the pages listed below, or by using the keyword search tool below to find specific information within the annual report.-
 1
1 -
2
-
3
-
4
-
5
-
6
-
7
-
8
-
9
-
10
-
11
-
12
-
13
-
14
-
15
-
16
-
17
-
18
-
19
-
20
-
21
-
22
-
23
-
24
-
25
-
26
-
27
-
 28
28 -
 29
29 -
 30
30 -
 31
31 -
 32
32 -
 33
33 -
 34
34 -
 35
35 -
 36
36 -
 37
37 -
 38
38 -
 39
39 -
 40
40 -
 41
41 -
 42
42 -
 43
43 -
 44
44 -
 45
45 -
 46
46
 |
 |

1 2 3 4 5 6 7 8 9 10 11 12 13 14 15
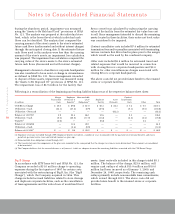
Notes to Consolidated Financial Statements
36
CVS Corporation
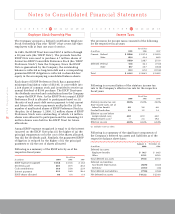
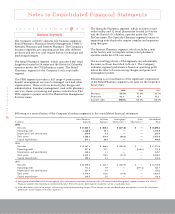
Employee Stock Ownership Plan
The Company sponsors a defined contribution Employee
Stock Ownership Plan (the “ESOP”) that covers full-time
employees with at least one year of service.
In 1989, the ESOP Trust borrowed $357.5 million through
a 20-year note (the “ESOP Note”). The proceeds from the
ESOP Note were used to purchase 6.7 million shares of
Series One ESOP Convertible Preference Stock (the “ESOP
Preference Stock”) from the Company. Since the ESOP
Note is guaranteed by the Company, the outstanding
balance is reflected as long-term debt and a corresponding
guaranteed ESOP obligation is reflected in shareholders’
equity in the accompanying consolidated balance sheets.
Each share of ESOP Preference Stock has a guaranteed
minimum liquidation value of $53.45, is convertible into
2.314 shares of common stock and is entitled to receive an
annual dividend of $3.90 per share. The ESOP Trust uses
the dividends received and contributions from the Company
to repay the ESOP Note. As the ESOP Note is repaid, ESOP
Preference Stock is allocated to participants based on: (i)
the ratio of each year’s debt service payment to total current
and future debt service payments multiplied by (ii) the
number of unallocated shares of ESOP Preference Stock in
the plan. As of January 1, 2000, 5.2 million shares of ESOP
Preference Stock were outstanding, of which 1.9 million
shares were allocated to participants and the remaining 3.3
million shares were held in the ESOP Trust for future
allocations.
Annual ESOP expense recognized is equal to (i) the interest
incurred on the ESOP Note plus (ii) the higher of (a) the
principal repayments or (b) the cost of the shares allocated,
less (iii) the dividends paid. Similarly, the guaranteed ESOP
obligation is reduced by the higher of (i) the principal
payments or (ii) the cost of shares allocated.
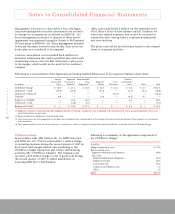
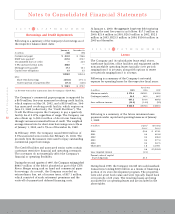
Following is a summary of the ESOP activity as of the
respective fiscal years:
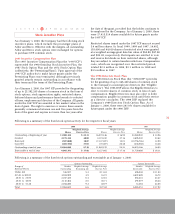
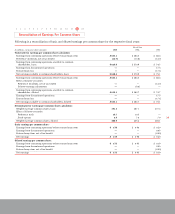
Income Taxes
The provision for income taxes consisted of the following
for the respective fiscal years:
Following is a reconciliation of the statutory income tax
rate to the Company’s effective tax rate for the respective
fiscal years:
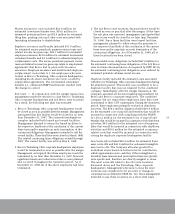
Following is a summary of the significant components of
the Company’s deferred tax assets and liabilities as of the
respective balance sheet dates:
1 2 3 4 5 6 7 8 910 11 12 13 14 15
Fiscal Year
In millions 1999 1998 1997
ESOP expense recognized $ 16.6 $ 25.8 $ 13.8
Dividends paid 20.1 20.5 20.8
Cash contributions 16.6 25.8 22.9
Interest payments 23.1 24.9 26.4
ESOP shares allocated 0.3 0.4 0.4
Fiscal Year
In millions 1999 1998 1997
Current: Federal $ 289.6 $ 197.3 $ 182.5
State 68.4 41.4 68.5
358.0 238.7 251.0
Deferred: Federal 72.6 44.1 (75.0)
State 10.7 23.7 (26.8)
83.3 67.8 (101.8)
Total $ 441.3 $ 306.5 $ 149.2
Fiscal Year
1999 1998 1997
Statutory income tax rate 35.0% 35.0% 35.0%
State income taxes, net of
federal tax benefit 4.8 5.8 6.6
Goodwill and other 1.2 1.2 1.4
Effective tax rate before
merger-related costs 41.0 42.0 43.0
Merger-related costs(1) —2.4 19.8
Effective tax rate 41.0% 44.4% 62.8%
(1) Includes state tax effect.
January 1, December 26,
In millions 2000 1998
Deferred tax assets:
Employee benefits $ 56.7 $ 84.5
Other 135.1 185.5
Total deferred tax assets 191.8 270.0
Deferred tax liabilities:
Accelerated depreciation (68.9) (44.0)
Inventory (10.7) (1.6)
Total deferred tax liabilities (79.6) (45.6)
Net deferred tax assets $ 112.2 $ 224.4