CVS 1999 Annual Report Download - page 24
Download and view the complete annual report
Please find page 24 of the 1999 CVS annual report below. You can navigate through the pages in the report by either clicking on the pages listed below, or by using the keyword search tool below to find specific information within the annual report.-
 1
1 -
2
-
3
-
4
-
5
-
6
-
7
-
8
-
9
-
10
-
11
-
12
-
13
-
 14
14 -
 15
15 -
 16
16 -
 17
17 -
 18
18 -
 19
19 -
 20
20 -
 21
21 -
 22
22 -
 23
23 -
 24
24 -
 25
25 -
 26
26 -
 27
27 -
 28
28 -
 29
29 -
 30
30 -
 31
31 -
 32
32 -
 33
33 -
 34
34 -
35
-
36
-
37
-
38
-
39
-
40
-
41
-
42
-
43
-
44
-
45
-
46
 |
 |

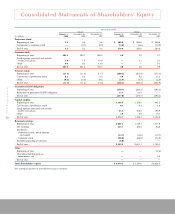
Consolidated Statements of Shareholders’ Equity
22
CVS Corporation
Fiscal Year Ended
Shares Dollars
January 1, December 26, December 27, January 1, December 26, December 27,
In millions 2000 1998 1997 2000 1998 1997
Preference stock:
Beginning of year 5.2 5.3 5.6 $ 280.0 $ 284.6 $ 298.6
Conversion to common stock —(0.1) (0.3) (4.0) (4.6) (14.0)
End of year 5.2 5.2 5.3 276.0 280.0 284.6
Common stock:
Beginning of year 401.4 393.7 369.3 4.0 3.9 3.7
Stock options exercised and awards
under stock plans 1.0 7.5 10.9 —0.1 0.1
Other 0.6 0.2 13.5 —— 0.1
End of year 403.0 401.4 393.7 4.0 4.0 3.9
Treasury stock:
Beginning of year (11.2) (11.3) (11.7) (260.2) (262.9) (273.1)
Conversion of preference stock 0.2 0.2 0.5 4.0 4.2 12.2
Other (0.1) (0.1) (0.1) (2.3) (1.5) (2.0)
End of year (11.1) (11.2) (11.3) (258.5) (260.2) (262.9)
Guaranteed ESOP obligation:
Beginning of year (270.7) (292.2) (292.2)
Reduction of guaranteed ESOP obligation 13.7 21.5 —
End of year (257.0) (270.7) (292.2)
Capital surplus:
Beginning of year 1,336.4 1,154.0 941.2
Conversion of preference stock 0.1 0.3 1.8
Stock options exercised and awards
under stock plans 31.3 176.2 195.9
Other 3.9 5.9 15.1
End of year 1,371.7 1,336.4 1,154.0
Retained earnings:
Beginning of year 2,021.1 1,739.1 1,737.9
Net earnings 635.1 384.5 88.8
Dividends:
Preference stock, net of income
tax benefit (14.7) (13.6) (13.7)
Common stock (90.0) (88.9) (73.9)
Immaterial pooling of interests (8.0) ——
End of year 2,543.5 2,021.1 1,739.1
Other:
Beginning of year —— (2.4)
Unrealized holding gain on
investments, net —— 2.4
End of year ———
Total shareholders’ equity $ 3,679.7 $ 3,110.6 $ 2,626.5
See accompanying notes to consolidated financial statements.