CVS 1999 Annual Report Download - page 37
Download and view the complete annual report
Please find page 37 of the 1999 CVS annual report below. You can navigate through the pages in the report by either clicking on the pages listed below, or by using the keyword search tool below to find specific information within the annual report.-
 1
1 -
2
-
3
-
4
-
5
-
6
-
7
-
8
-
9
-
10
-
11
-
12
-
13
-
14
-
15
-
16
-
17
-
18
-
19
-
20
-
21
-
22
-
23
-
24
-
25
-
26
-
 27
27 -
 28
28 -
 29
29 -
 30
30 -
 31
31 -
 32
32 -
 33
33 -
 34
34 -
 35
35 -
 36
36 -
 37
37 -
 38
38 -
 39
39 -
 40
40 -
 41
41 -
 42
42 -
 43
43 -
 44
44 -
 45
45 -
 46
46
 |
 |

35
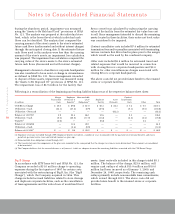
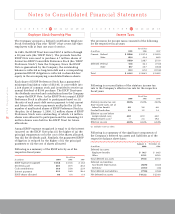
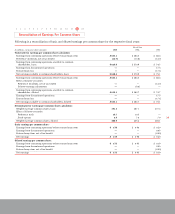
Defined Benefit Plans Other Postretirement Benefits
In millions 1999 1998 1997 1999 1998 1997
Service cost(1) $ 0.7 $ 0.5 $ 7.6 $— $— $—
Interest cost on benefit obligation 19.8 19.5 19.2 0.9 1.0 1.0
Expected return on plan assets (16.6) (16.4) (14.9) ———
Amortization of net loss (gain) 1.3 1.2 0.3 —(0.2) —
Amortization of prior service cost 0.1 0.1 0.3 (0.1) (0.1) (0.3)
Curtailment gain —— (6.0) ———
Net periodic pension cost $ 5.3 $ 4.9 $ 6.5 $ 0.8 $ 0.7 $ 0.7
Weighted average assumptions:
Discount rate 8.00% 6.75% 7.25% 7.75% 6.75% 7.25%
Expected return on plan assets 9.00% 9.00% 9.00% ———
Rate of compensation increase 4.00% 4.50% 4.50% ———
(1) The decrease in total service cost is primarily due to the suspension of future benefit accruals under the Revco pension plan during 1997.
For measurement purposes, future healthcare costs are assumed to increase at an annual rate of 9.0%, decreasing to an
annual growth rate of 5.0% in 2004 and thereafter. A one percent change in the assumed healthcare cost trend rate would
change the accumulated postretirement benefit obligation by $0.9 million and the total service and interest costs by $0.1
million.
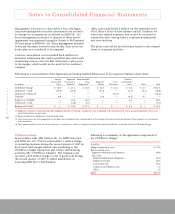
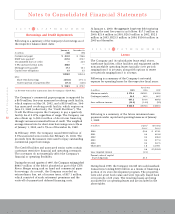
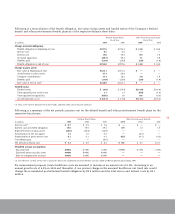
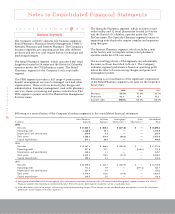
Following is a reconciliation of the benefit obligation, fair value of plan assets and funded status of the Company’s defined
benefit and other postretirement benefit plans as of the respective balance sheet dates:
Defined Benefit Plans Other Postretirement Benefits
Fiscal Year Fiscal Year
In millions 1999 1998 1999 1998
Change in benefit obligation:
Benefit obligation at beginning of year $ 297.6 $ 253.3 $ 14.0 $ 14.4
Service cost 0.7 0.5 ——
Interest cost 19.8 19.5 0.9 1.0
Actuarial (gain) loss (40.3) 49.3 1.1 0.5
Benefits paid (23.0) (25.0) (2.0) (1.9)
Benefit obligation at end of year $ 254.8 $ 297.6 $ 14.0 $ 14.0
Change in plan assets:
Fair value at beginning of year $ 223.1 $ 201.5 $— $—
Actual return on plan assets 37.3 28.4 ——
Company contributions 11.4 18.2 2.0 1.9
Benefits paid (23.0) (25.0) (2.0) (1.9)
Fair value at end of year(1) $ 248.8 $ 223.1 $— $—
Funded status:
Funded status $ (6.0) $ (74.5) $ (14.0) $ (14.0)
Unrecognized prior service cost 1.1 1.3 (0.9) (1.0)
Unrecognized net (gain) loss (60.6) 1.6 0.8 (0.3)
Accrued pension costs $ (65.5) $ (71.6) $ (14.1) $ (15.3)
(1) Plan assets consist primarily of mutual funds, common stock and insurance contracts.
Following is a summary of the net periodic pension cost for the defined benefit and other postretirement benefit plans for the
respective fiscal years: