CVS 1999 Annual Report Download - page 16
Download and view the complete annual report
Please find page 16 of the 1999 CVS annual report below. You can navigate through the pages in the report by either clicking on the pages listed below, or by using the keyword search tool below to find specific information within the annual report.-
 1
1 -
2
-
3
-
4
-
5
-
 6
6 -
 7
7 -
 8
8 -
 9
9 -
 10
10 -
 11
11 -
 12
12 -
 13
13 -
 14
14 -
 15
15 -
 16
16 -
 17
17 -
 18
18 -
 19
19 -
 20
20 -
 21
21 -
 22
22 -
 23
23 -
 24
24 -
 25
25 -
 26
26 -
27
-
28
-
29
-
30
-
31
-
32
-
33
-
34
-
35
-
36
-
37
-
38
-
39
-
40
-
41
-
42
-
43
-
44
-
45
-
46
 |
 |

14
CVS Corporation
We strongly recommend that you read our accompanying
audited consolidated financial statements and footnotes
along with this important discussion and analysis.
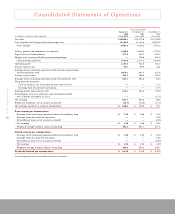
Results of Operations
Fiscal 1999, which ended on January 1, 2000, included
53 weeks, while fiscal 1998 and 1997, which ended on
December 26, 1998 and December 27, 1997, respectively,
included 52 weeks.
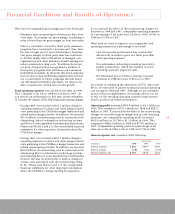
Net sales increased 18.5% in 1999 to $18.1 billion. This
compares to increases of 11.1% in 1998 and 16.2% in 1997.
Same-store sales, consisting of sales from stores that have
been open for more than one year, rose 12.5% in 1999,
10.8% in 1998 and 9.7% in 1997. Pharmacy same-store
sales increased 19.4% in 1999 and 16.5% in 1998 and
1997. Our pharmacy sales as a percentage of total net sales
were 59% in 1999, 58% in 1998 and 55% in 1997. Our
third party prescription sales as a percentage of total
pharmacy sales were 87% in 1999, 84% in 1998 and 81%
in 1997.
As you review our sales performance, we believe you
should consider the following important information:
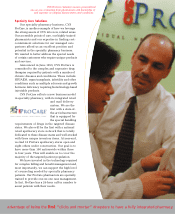
•Our pharmacy sales growth continued to benefit
from our ability to attract and retain managed care
customers, our ongoing program of purchasing
prescription files from independent pharmacies and
favorable industry trends. These trends include an
aging American population; many “baby boomers”
are now in their fifties and are consuming a greater
number of prescription drugs. The increased use of
pharmaceuticals as the first line of defense for
healthcare and the introduction of a number of
successful new prescription drugs also contributed
to the growing demand for pharmacy services.
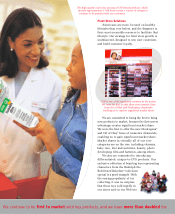
•Our front store sales growth was driven by strong
performance in the health and beauty, photo,
seasonal, and general merchandise categories.
•The increase in net sales in 1999 was positively
affected by the 53rd week. Excluding the positive
impact of the 53rd week, net sales increased 16.0%
in 1999 when compared to 1998.
•The increase in net sales in 1998 was positively
affected by our efforts to improve the performance
of the Revco stores. To do this, we converted the
retained Revco stores to the CVS store format and
relocated certain stores. Our performance during the
conversion period was positively affected by
temporary promotional events.
•The increase in net sales in 1997 was positively
affected by our acquisition of Big B, Inc., effective
November 16, 1996. Excluding the positive impact
of the Big B acquisition, net sales increased 11.3%
in 1997 when compared to 1996. Please read Note 3
to the consolidated financial statements for other
important information about the Big B acquisition.
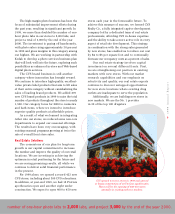
•We continued to relocate our existing shopping
center stores to larger, more convenient, freestanding
locations. Historically, we have achieved significant
improvements in customer count and net sales when
we do this. The resulting increase in net sales has
typically been driven by an increase in front store
sales, which normally have a higher gross margin.
We believe that our relocation program offers a
significant opportunity for future growth, as only
33% of our existing stores are freestanding. We
currently expect to have approximately 40% of our
stores in freestanding locations by the end of 2000.
Our long-term goal is to have 80% of our stores
located in freestanding sites. We cannot, however,
guarantee that future store relocations will deliver
the same results as those historically achieved.
Please read the “Cautionary Statement Concerning
Forward-Looking Statements” section below.
Gross margin as a percentage of net sales was 26.9% in
1999. This compares to 27.0% in 1998 and 1997. Inventory
shrinkage was 0.9% of net sales in 1999, compared to 0.8%
of net sales in 1998 and 1997. As you review our gross
margin performance, please remember to consider the
impact of the following nonrecurring charges:
•During 1998, we recorded a $10.0 million charge to cost
of goods sold to reflect markdowns on noncompatible
Arbor merchandise, which resulted from the CVS/
Arbor merger transaction. Please read Notes 2 and 3
to the consolidated financial statements for other
important information about the CVS/Arbor merger.
•During 1997, we recorded a $75.0 million charge to cost
of goods sold to reflect markdowns on noncompatible
Revco merchandise, which resulted from the CVS/
Revco merger transaction. Please read Notes 2 and 3
to the consolidated financial statements for other
important information about the CVS/Revco merger.
If you exclude the effect of these nonrecurring charges, our
comparable gross margin as a percentage of net sales was
26.9% in 1999, 27.1% in 1998 and 27.6% in 1997.
Management’s Discussion and Analysis of