CVS 1999 Annual Report Download - page 22
Download and view the complete annual report
Please find page 22 of the 1999 CVS annual report below. You can navigate through the pages in the report by either clicking on the pages listed below, or by using the keyword search tool below to find specific information within the annual report.-
 1
1 -
2
-
3
-
4
-
5
-
6
-
7
-
8
-
9
-
10
-
11
-
 12
12 -
 13
13 -
 14
14 -
 15
15 -
 16
16 -
 17
17 -
 18
18 -
 19
19 -
 20
20 -
 21
21 -
 22
22 -
 23
23 -
 24
24 -
 25
25 -
 26
26 -
 27
27 -
 28
28 -
 29
29 -
 30
30 -
 31
31 -
 32
32 -
33
-
34
-
35
-
36
-
37
-
38
-
39
-
40
-
41
-
42
-
43
-
44
-
45
-
46
 |
 |

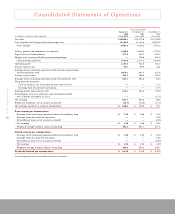
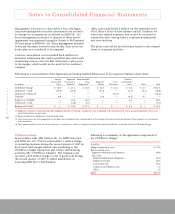
Consolidated Statements of Operations
20
CVS Corporation
Fiscal Year Ended
January 1, December 26, December 27,
2000 1998 1997
In millions, except per share amounts (53 weeks) (52 weeks) (52 weeks)
Net sales $18,098.3 $ 15,273.6 $ 13,749.6
Cost of goods sold, buying and warehousing costs 13,236.9 11,144.4 10,031.3
Gross margin 4,861.4 4,129.2 3,718.3
Selling, general and administrative expenses 3,448.0 2,949.0 2,776.0
Depreciation and amortization 277.9 249.7 238.2
Merger, restructuring and other nonrecurring charges —178.6 422.4
Total operating expenses 3,725.9 3,377.3 3,436.6
Operating profit 1,135.5 751.9 281.7
Interest expense, net 59.1 60.9 44.1
Earnings from continuing operations before income tax provision
and extraordinary item 1,076.4 691.0 237.6
Income tax provision 441.3 306.5 149.2
Earnings from continuing operations before extraordinary item 635.1 384.5 88.4
Discontinued operations:
Gain on disposal, net of income tax provision of $12.4 —— 17.5
Earnings from discontinued operations —— 17.5
Earnings before extraordinary item 635.1 384.5 105.9
Extraordinary item, loss related to early retirement of debt,
net of income tax benefit of $11.4 —— (17.1)
Net earnings 635.1 384.5 88.8
Preference dividends, net of income tax benefit (14.7) (13.6) (13.7)
Net earnings available to common shareholders $ 620.4 $ 370.9 $ 75.1
Basic earnings per common share:
Earnings from continuing operations before extraordinary item $ 1.59 $ 0.96 $ 0.20
Earnings from discontinued operations —— 0.05
Extraordinary item, net of income tax benefit —— (0.05)
Net earnings $ 1.59 $ 0.96 $ 0.20
Weighted average common shares outstanding 391.3 387.1 377.2
Diluted earnings per common share:
Earnings from continuing operations before extraordinary item $ 1.55 $ 0.95 $ 0.19
Earnings from discontinued operations —— 0.05
Extraordinary item, net of income tax benefit —— (0.05)
Net earnings $ 1.55 $ 0.95 $ 0.19
Weighted average common shares outstanding 408.9 405.2 385.1
Dividends declared per common share $ 0.230 $ 0.225 $ 0.220
See accompanying notes to consolidated financial statements.