CVS 1999 Annual Report Download - page 34
Download and view the complete annual report
Please find page 34 of the 1999 CVS annual report below. You can navigate through the pages in the report by either clicking on the pages listed below, or by using the keyword search tool below to find specific information within the annual report.-
 1
1 -
2
-
3
-
4
-
5
-
6
-
7
-
8
-
9
-
10
-
11
-
12
-
13
-
14
-
15
-
16
-
17
-
18
-
19
-
20
-
21
-
22
-
23
-
 24
24 -
 25
25 -
 26
26 -
 27
27 -
 28
28 -
 29
29 -
 30
30 -
 31
31 -
 32
32 -
 33
33 -
 34
34 -
 35
35 -
 36
36 -
 37
37 -
 38
38 -
 39
39 -
 40
40 -
 41
41 -
 42
42 -
 43
43 -
 44
44 -
45
-
46
 |
 |
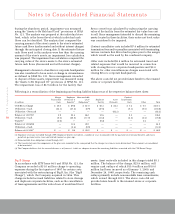
Notes to Consolidated Financial Statements
32
CVS Corporation
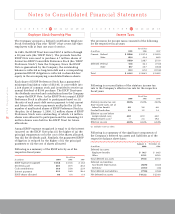
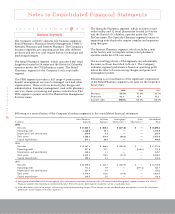
Borrowings and Credit Agreements
Following is a summary of the Company’s borrowings as of
the respective balance sheet dates:
The Company’s commercial paper program is supported by
a $670 million, five-year unsecured revolving credit facility,
which expires on May 30, 2002, and a $530 million, 364-
day unsecured revolving credit facility, which expires on
June 21, 2000 (collectively, the “Credit Facilities”). The
Credit Facilities require the Company to pay a quarterly
facility fee of 0.07%, regardless of usage. The Company can
also obtain up to $35.0 million of short-term financing
through various uncommitted lines of credit. The weighted
average interest rate for short-term borrowings was 6.2% as
of January 1, 2000, and 5.7% as of December 26, 1998.
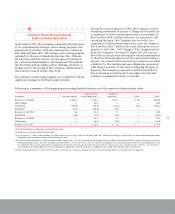
In February 1999, the Company issued $300 million of
5.5% unsecured senior notes due February 15, 2004. The
proceeds from the issuance were used to repay outstanding
commercial paper borrowings.
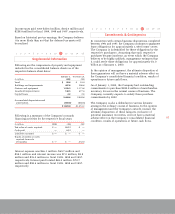
The Credit Facilities and unsecured senior notes contain
customary restrictive financial and operating covenants.
The covenants do not materially affect the Company’s
financial or operating flexibility.
During the second quarter of 1997, the Company extinguished
$865.7 million of the debt it absorbed as part of the CVS/
Revco Merger using cash on hand and commercial paper
borrowings. As a result, the Company recorded an
extraordinary loss, net of income taxes, of $17.1 million,
which consisted of early retirement premiums and the
write-off of unamortized deferred financing costs.
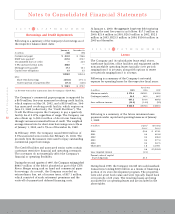
At January 1, 2000, the aggregate long-term debt maturing
during the next five years is as follows: $17.3 million in
2000, $21.6 million in 2001, $26.5 million in 2002, $32.3
million in 2003, $323.5 million in 2004, $154.6 million in
2005 and thereafter.
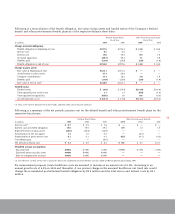
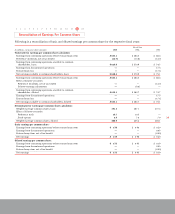
Leases
The Company and its subsidiaries lease retail stores,
warehouse facilities, office facilities and equipment under
noncancelable operating leases typically over periods
ranging from 5 to 20 years, along with options to renew
over periods ranging from 5 to 15 years.
Following is a summary of the Company’s net rental
expense for operating leases for the respective fiscal years:
Following is a summary of the future minimum lease
payments under capital and operating leases as of January
1, 2000:
During fiscal 1999, the Company entered into sale-leaseback
transactions totaling $229 million as a means of financing a
portion of its store development program. The properties
were sold at net book value and were typically leased back
over periods of 20 years. The resulting leases are being
accounted for as operating leases and are included in the
above tables.
1 2 3 4 56 7 8 9 10 11 12 13 14 15
1 2 3 4 5 67 8 9 10 11 12 13 14 15
January 1, December 26,
In millions 2000 1998
Commercial paper $ 451.0 $ 736.6
ESOP note payable(1) 257.0 270.7
Uncommitted lines of credit —34.5
5.5% unsecured senior notes 300.0 —
Mortgage notes payable 17.3 16.1
Capital lease obligations 1.5 3.5
1,026.8 1,061.4
Less:
Short-term borrowings (451.0) (771.1)
Current portion of long-term debt (17.3) (14.6)
$ 558.5 $ 275.7
(1) See Note 9 for further information about the Company’s ESOP Plan.
Fiscal Year
In millions 1999 1998 1997
Minimum rentals $ 572.4 $ 459.1 $ 409.6
Contingent rentals 64.8 60.3 60.2
637.2 519.4 469.8
Less: sublease income (13.2) (14.0) (9.5)
$ 624.0 $ 505.4 $ 460.3
In millions Capital Operating
Leases Leases
2000 $ 0.4 $ 474.1
2001 0.4 441.8
2002 0.4 406.0
2003 0.4 377.4
2004 0.4 347.5
Thereafter 1.6 3,159.1
3.6 $ 5,205.9
Less: imputed interest (2.1)
Present value of capital
lease obligations $ 1.5