CVS 1999 Annual Report Download - page 17
Download and view the complete annual report
Please find page 17 of the 1999 CVS annual report below. You can navigate through the pages in the report by either clicking on the pages listed below, or by using the keyword search tool below to find specific information within the annual report.-
 1
1 -
2
-
3
-
4
-
5
-
6
-
 7
7 -
 8
8 -
 9
9 -
 10
10 -
 11
11 -
 12
12 -
 13
13 -
 14
14 -
 15
15 -
 16
16 -
 17
17 -
 18
18 -
 19
19 -
 20
20 -
 21
21 -
 22
22 -
 23
23 -
 24
24 -
 25
25 -
 26
26 -
 27
27 -
28
-
29
-
30
-
31
-
32
-
33
-
34
-
35
-
36
-
37
-
38
-
39
-
40
-
41
-
42
-
43
-
44
-
45
-
46
 |
 |

15
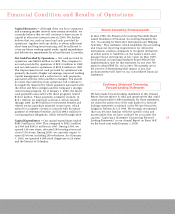
Why has our comparable gross margin rate been declining?
•Pharmacy sales are growing at a faster pace than front
store sales. On average, our gross margin on pharmacy
sales is lower than our gross margin on front store sales.
•Sales to customers covered by third party insurance
programs have continued to increase and, thus, have
become a larger part of our total pharmacy business.
Our gross margin on third party sales has continued
to decline largely due to the efforts of managed care
organizations and other pharmacy benefit managers to
reduce prescription drug costs. To address this trend,
we have dropped and/or renegotiated a number of
third party programs that fell below our minimum
profitability standards. In the event this trend continues
and we elect to drop additional programs and/or decide
not to participate in future programs that fall below
our minimum profitability standards, we may not be
able to sustain our current rate of sales growth.
Total operating expenses were 20.6% of net sales in 1999.
This compares to 22.1% in 1998 and 25.0% in 1997. As
you review our performance in this area, please remember
to consider the impact of the following nonrecurring charges:
•During 1998, we recorded a $147.3 million charge to
operating expenses for direct and other merger-related
costs pertaining to the CVS/Arbor merger transaction and
related restructuring activities. In addition, we incurred
$31.3 million of nonrecurring costs in connection with
eliminating Arbor’s information technology systems
and Revco’s noncompatible store merchandise fixtures.
Please read Notes 2 and 3 to the consolidated financial
statements for other important information about the
CVS/Arbor merger.
•During 1997, we recorded a $337.1 million charge to
operating expenses for direct and other merger-related
costs pertaining to the CVS/Revco merger transaction and
related restructuring activities. In addition, we incurred
$54.3 million of nonrecurring costs in connection with
eliminating Revco’s information technology systems
and removing Revco’s noncompatible store merchandise
fixtures. We also recorded a $31.0 million charge for
certain costs associated with the restructuring of Big
B, Inc. Please read Notes 2 and 3 to the consolidated
financial statements for other important information
about the CVS/Revco merger and Big B acquisition.
If you exclude the effect of the nonrecurring charges we
incurred in 1998 and 1997, comparable operating expenses
as a percentage of net sales were 20.6% in 1999, 20.9% in
1998 and 21.9% in 1997.
What have we done to improve our comparable total
operating expenses as a percentage of net sales?
•Our strong sales performance has consistently
allowed our net sales to grow at a faster pace than
total operating expenses.
•Our information technology initiatives have led to
greater productivity, which has resulted in lower
operating costs and improved sales.
•We eliminated most of Arbor’s existing corporate
overhead in 1998 and most of Revco’s in 1997.
As a result of combining the operations of CVS, Arbor and
Revco, we were able to achieve substantial annual operating
cost savings in 1998 and 1997. Although we are extremely
proud of this accomplishment, we strongly advise you not
to rely on the resulting operating expense improvement
trend to predict our future performance.
Operating profit increased $383.6 million to $1.1 billion in
1999. This compares to $751.9 million in 1998 and $281.7
million in 1997. If you exclude the effect of the nonrecurring
charges we recorded in gross margin and in total operating
expenses, our comparable operating profit increased
$195.0 million (or 20.7%) to $1.1 billion in 1999. This
compares to $940.5 million in 1998 and $779.1 million in
1997. Comparable operating profit as a percentage of net
sales was 6.3% in 1999, 6.2% in 1998 and 5.7% in 1997.
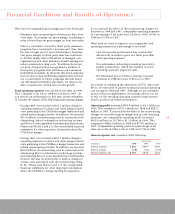
Interest expense, net consisted of the following:
Fiscal Year
In millions 1999 1998 1997
Interest expense $ 66.1 $ 69.7 $ 59.1
Interest income (7.0) (8.8) (15.0)
Interest expense, net $ 59.1 $ 60.9 $ 44.1
Financial Condition and Results of Operations