Blackberry 2008 Annual Report Download - page 73
Download and view the complete annual report
Please find page 73 of the 2008 Blackberry annual report below. You can navigate through the pages in the report by either clicking on the pages listed below, or by using the keyword search tool below to find specific information within the annual report.-
 1
1 -
2
-
3
-
4
-
5
-
6
-
7
-
8
-
9
-
10
-
11
-
12
-
13
-
14
-
15
-
16
-
17
-
18
-
19
-
20
-
21
-
22
-
23
-
24
-
25
-
26
-
27
-
28
-
29
-
30
-
31
-
32
-
33
-
34
-
35
-
36
-
37
-
38
-
39
-
40
-
41
-
42
-
43
-
44
-
45
-
46
-
47
-
48
-
49
-
50
-
51
-
52
-
53
-
54
-
55
-
56
-
57
-
58
-
59
-
60
-
61
-
62
-
 63
63 -
 64
64 -
 65
65 -
 66
66 -
 67
67 -
 68
68 -
 69
69 -
 70
70 -
 71
71 -
 72
72 -
 73
73 -
 74
74 -
 75
75 -
 76
76 -
 77
77 -
 78
78 -
 79
79 -
 80
80 -
 81
81 -
 82
82 -
 83
83 -
84
-
85
-
86
-
87
-
88
 |
 |

71
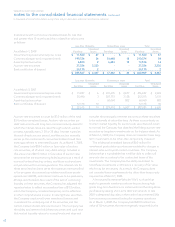
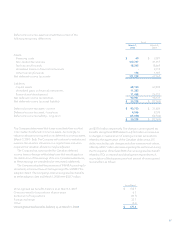
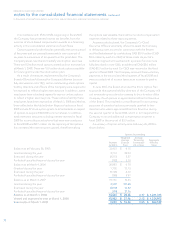
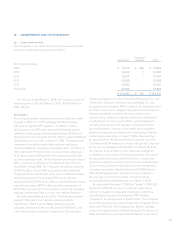
The aggregate intrinsic value in the table above represents
the total pre-tax intrinsic value (the aggregate difference
between the closing stock price of the Company’s common
stock on March 1, 2008 and the exercise price for in-the-
money options) that would have been received by the option
holders if all in-the-money options had been exercised on
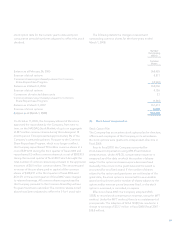
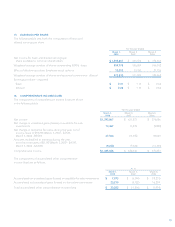
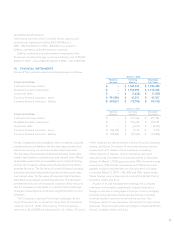
As of March 1, 2008, there was $133.6 million of unrecognized
stock-based compensation expense related to unvested
stock options which will be expensed over the vesting period,
which, on a weighted-average basis, results in a period of
approximately 2.5 years. The total fair value of stock options
vested during the year ended March 1, 2008 was $23.9 million.
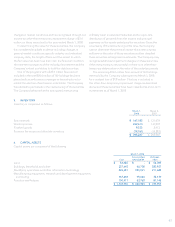
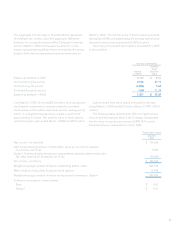
Options Outstanding
Number
(in 000’s)
Average
Grant
Date Fair
Value
Balance as at March 3, 2007 9,129 $ 8.03
Granted during the period 2,518 47.11
Vested during the period (4,226) 5.65
Forfeited during the period (164) 11.76
Balance as at March 1, 2008 7,257 $ 22.89
March 1, 2008. The intrinsic value of stock options exercised
during fiscal 2008, calculated using the average market price
during the period, was approximately $70 per share.
A summary of unvested stock options since March 3, 2007
is shown below:
Cash received from stock option exercises for the year
ended March 1, 2008 was $62.9 million (March 3, 2007 - $44.5
million).
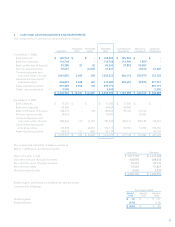
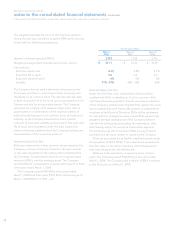
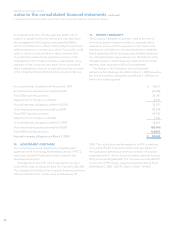
The following table illustrates the effect on reported net
income and earnings per share if the Company had applied
the fair value recognition provisions of SFAS 123 to stock-
based employee compensation in fiscal 2006:
For the year ended
March 4,
2006
Net income - as reported $ 374,656
Add: Stock-based employee compensation expense included in restated
net income, net of tax 5,942
Deduct: Total stock-based employee compensation expense determined under
fair value method for all awards, net of tax (25,000)
Net income - pro forma $ 355,598
Weighted-average number of shares outstanding (000’s) - basic 566,742
Effect of dilutive securities: Employee stock options 19,788
Weighted-average number of shares and assumed conversions - diluted 586,530
Pro forma earnings per common share:
Basic $ 0.63
Diluted $ 0.61