Blackberry 2008 Annual Report Download - page 54
Download and view the complete annual report
Please find page 54 of the 2008 Blackberry annual report below. You can navigate through the pages in the report by either clicking on the pages listed below, or by using the keyword search tool below to find specific information within the annual report.-
 1
1 -
2
-
3
-
4
-
5
-
6
-
7
-
8
-
9
-
10
-
11
-
12
-
13
-
14
-
15
-
16
-
17
-
18
-
19
-
20
-
21
-
22
-
23
-
24
-
25
-
26
-
27
-
28
-
29
-
30
-
31
-
32
-
33
-
34
-
35
-
36
-
37
-
38
-
39
-
40
-
41
-
42
-
43
-
 44
44 -
 45
45 -
 46
46 -
 47
47 -
 48
48 -
 49
49 -
 50
50 -
 51
51 -
 52
52 -
 53
53 -
 54
54 -
 55
55 -
 56
56 -
 57
57 -
 58
58 -
 59
59 -
 60
60 -
 61
61 -
 62
62 -
 63
63 -
 64
64 -
65
-
66
-
67
-
68
-
69
-
70
-
71
-
72
-
73
-
74
-
75
-
76
-
77
-
78
-
79
-
80
-
81
-
82
-
83
-
84
-
85
-
86
-
87
-
88
 |
 |

52
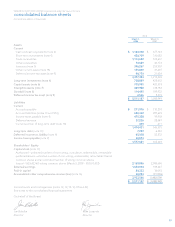
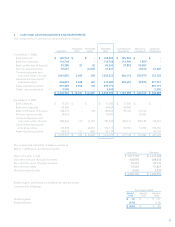
RESEARCH IN MOTION LIMITED
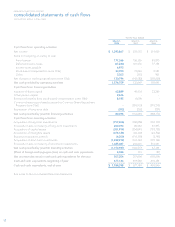
consolidated statements of cash flows
(United States dollars, in thousands)
For the Year Ended
March 1,
2008 March 3,
2007 March 4,
2006
Cash flows from operating activities
Net income $ 1,293,867 $ 631,572 $ 374,656
Items not requiring an outlay of cash:
Amortization 177,366 126,355 85,873
Deferred income taxes (67,244) 101,576 77,154
Income taxes payable 4,973 - -
Stock-based compensation (note 11(b)) 33,700 19,063 2,551
Other 3,303 (315) 507
Net changes in working capital items (note 17(a)) 130,794 (142,582) (390,650)
Net cash provided by operating activities 1,576,759 735,669 150,091
Cash flows from financing activities
Issuance of share capital 62,889 44,534 23,269
Other paid-in capital 9,626 - -
Excess tax benefits from stock-based compensation (note 11(b)) 8,185 6,000 -
Common shares repurchased pursuant to Common Share Repurchase
Program (note 11(a)) -(203,933) (391,212)
Repayment of long-term debt (302) (262) (229)
Net cash provided by (used in) financing activities 80,398 (153,661) (368,172)
Cash flows from investing activities
Acquisition of long-term investments (757,656) (100,080) (103,179)
Proceeds on sale or maturity of long-term investments 260,393 86,583 61,495
Acquisition of capital assets (351,914) (254,041) (178,732)
Acquisition of intangible assets (374,128) (60,303) (23,702)
Business acquisitions (note 8) (6,200) (116,190) (3,795)
Acquisition of short-term investments (1,249,919) (163,147) (199,194)
Proceeds on sale or maturity of short-term investments 1,325,487 242,601 514,431
Net cash provided by (used in) investing activities (1,153,937) (364,577) 67,324
Effect of foreign exchange gain (loss) on cash and cash equivalents 4,034 173 (57)
Net increase (decrease) in cash and cash equivalents for the year 507,254 217,604 (150,814)
Cash and cash equivalents, beginning of year 677,144 459,540 610,354
Cash and cash equivalents, end of year $ 1,184,398 $ 677,144 $ 459,540
See notes to the consolidated financial statements.