Blackberry 2008 Annual Report Download - page 32
Download and view the complete annual report
Please find page 32 of the 2008 Blackberry annual report below. You can navigate through the pages in the report by either clicking on the pages listed below, or by using the keyword search tool below to find specific information within the annual report.
RESEARCH IN MOTION LIMITED
management’s discussion and analysis of financial
condition and results of operations continued
FOR THE THREE MONTHS AND FISCAL YEAR ENDED MARCH 1, 2008
30
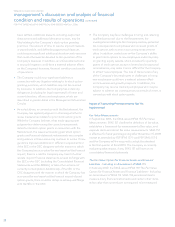
as a process designed by, or under the supervision of,
the Company’s principal executive and principal financial
officers and effected by the Company’s Board of Directors,
management and other personnel to provide reasonable
assurance regarding the reliability of financial reporting and
the preparation of financial statements for external purposes
in accordance with U.S. GAAP and includes those policies and
procedures that:
• pertain to the maintenance of records that in reasonable
detail accurately and fairly reflect the transactions and
dispositions of the assets of the Company;
• provide reasonable assurance that transactions are
recorded as necessary to permit preparation of
financial statements in accordance with U.S. GAAP, and
that receipts and expenditures of the Company are
being made only in accordance with authorizations of
management and directors of the Company; and
• provide reasonable assurance regarding prevention
or timely detection of unauthorized acquisition, use or
disposition of the Company’s assets that could have a
material effect on the financial statements.
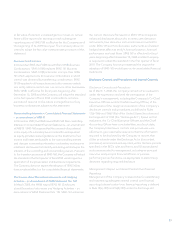
Because of its inherent limitations, internal control over
financial reporting may not prevent or detect misstatements.
Projections of any evaluation of effectiveness to future
periods are subject to the risks that controls may become
inadequate because of changes in conditions, or that the
degree of compliance with the policies or procedures may
deteriorate.
Management assessed the effectiveness of the Company’s
internal control over financial reporting as of March 1, 2008.
In making this assessment, management used the criteria set
forth by the Committee of Sponsoring Organizations of the
Treadway Commission (COSO) in Internal Control-Integrated
Framework. Based on this assessment, management believes
that, as of March 1, 2008, the Company’s internal control over
financial reporting was effective.
The Company’s independent auditors have issued an
audit report on the Company’s internal control over financial
reporting. This report is included with the Consolidated
Financial Statements.
Changes in Internal Control Over Financial Reporting
During the fiscal year ended March 1, 2008, no changes
were made to the Company’s internal control over financial
reporting that have materially affected, or are reasonably
likely to materially affect, the Company’s internal control over
financial reporting.
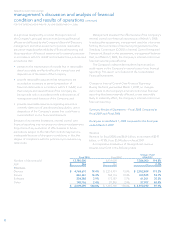
Summary Results of Operations – Fiscal 2008 Compared to
Fiscal 2007 and Fiscal 2006
Fiscal year ended March 1, 2008 compared to the fiscal year
ended March 3, 2007
Revenue
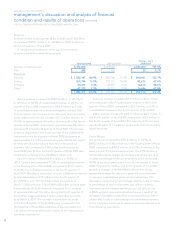
Revenue for fiscal 2008 was $6.01 billion, an increase of $2.97
billion, or 97.9%, from $3.04 billion in fiscal 2007.
A comparative breakdown of the significant revenue
streams is set forth in the following table:
Fiscal 2008 Fiscal 2007 Change - Fiscal
2008/2007
Number of devices sold 13,780,000 6,414,000 7,366,000 114.8%
ASP $ 346 $ 346 — 0.0%
Revenues
Devices $ 4,768,610 79.4% $ 2,215,951 73.0% $ 2,552,659 115.2%
Service 860,641 14.3% 560,116 18.4% 300,525 53.7%
Software 234,388 3.9% 173,187 5.7% 61,201 35.3%
Other 145,756 2.4% 87,849 2.9% 57,907 65.9%
$ 6,009,395 100.0% $ 3,037,103 100.0% $ 2,972,292 97.9%


