Blackberry 2008 Annual Report Download - page 20
Download and view the complete annual report
Please find page 20 of the 2008 Blackberry annual report below. You can navigate through the pages in the report by either clicking on the pages listed below, or by using the keyword search tool below to find specific information within the annual report.-
 1
1 -
2
-
3
-
4
-
5
-
6
-
7
-
8
-
9
-
 10
10 -
 11
11 -
 12
12 -
 13
13 -
 14
14 -
 15
15 -
 16
16 -
 17
17 -
 18
18 -
 19
19 -
 20
20 -
 21
21 -
 22
22 -
 23
23 -
 24
24 -
 25
25 -
 26
26 -
 27
27 -
 28
28 -
 29
29 -
 30
30 -
31
-
32
-
33
-
34
-
35
-
36
-
37
-
38
-
39
-
40
-
41
-
42
-
43
-
44
-
45
-
46
-
47
-
48
-
49
-
50
-
51
-
52
-
53
-
54
-
55
-
56
-
57
-
58
-
59
-
60
-
61
-
62
-
63
-
64
-
65
-
66
-
67
-
68
-
69
-
70
-
71
-
72
-
73
-
74
-
75
-
76
-
77
-
78
-
79
-
80
-
81
-
82
-
83
-
84
-
85
-
86
-
87
-
88
 |
 |

RESEARCH IN MOTION LIMITED
management’s discussion and analysis of financial
condition and results of operations continued
FOR THE THREE MONTHS AND FISCAL YEAR ENDED MARCH 1, 2008
18
As at and for the Fiscal Year Ended
March 1, 2008 March 3, 2007 Change
2008/2007 March 4, 2006 Change
2007/2006
(in thousands, except for per share amounts)
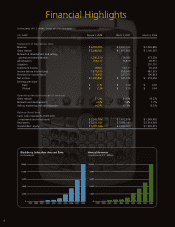
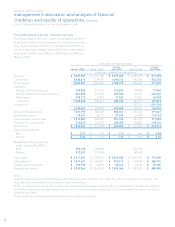
Revenue $ 6,009,395 $ 3,037,103 $ 2,972,292 $ 2,065,845 $ 971,258
Cost of sales 2,928,814 1,379,301 1,549,513 925,598 453,703
Gross margin 3,080,581 1,657,802 1,422,779 1,140,247 517,555
Expenses
Research and development 359,828 236,173 123,655 158,887 77,286
Selling, marketing and administration 881,482 537,922 343,560 314,317 223,605
Amortization 108,112 76,879 31,233 49,951 26,928
Sub-total 1,349,422 850,974 498,448 523,155 327,819
Litigation (1) ---201,791 (201,791)
1,349,422 850,974 498,448 724,946 126,028
Income from operations 1,731,159 806,828 924,331 415,301 391,527
Investment income 79,361 52,117 27,244 66,218 (14,101)
Income before income taxes 1,810,520 858,945 951,575 481,519 377,426
Provision for income taxes 516,653 227,373 289,280 106,863 120,510
Net income $ 1,293,867 $ 631,572 $ 662,295 $ 374,656 $ 256,916
Earnings per share (2)
Basic $ 2.31 $ 1.14 $ 1.17 $ 0.66 $ 0.48
Diluted $ 2.26 $ 1.10 $ 1.16 $ 0.64 $ 0.46
Weighted-average number of
shares outstanding (000's)
Basic 559,778 556,059 566,742
Diluted 572,830 571,809 588,468
Total assets $ 5,511,187 $ 3,088,949 $ 2,422,238 $ 2,314,349 $ 774,600
Total liabilities $ 1,577,621 $ 605,449 $ 972,172 $ 318,934 $ 286,515
Total long-term liabilities $ 103,190 $ 58,874 $ 44,316 $ 34,709 $ 24,165
Shareholders' equity $ 3,933,566 $ 2,483,500 $ 1,450,066 $ 1,995,415 $ 488,085
Notes:
(1) Reflects the resolution of the patent litigation between the Company and NTP in fiscal 2006. See “Results of Operations – Litigation” and
Note 12(b) to the Consolidated Financial Statements for further details.
(2) Basic and diluted earnings per share and basic and diluted weighted-average number of shares outstanding for fiscal 2008, fiscal 2007 and
fiscal 2006, as presented in the table above, reflect the 3-for-1 stock split implemented by way of a stock dividend that was paid in the second
quarter of fiscal 2008.
The Company has not paid any cash dividends during the last three fiscal years.
Fiscal 2008 Operating Results – Executive Summary
The following table sets forth certain consolidated statement
of operations data, which is expressed in thousands of dollars
and as a percentage of revenue for the periods indicated, as
well as consolidated balance sheet data, which is expressed in
thousands of dollars, as at March 1, 2008, March 3, 2007 and
March 4, 2006.