Blackberry 2008 Annual Report Download - page 42
Download and view the complete annual report
Please find page 42 of the 2008 Blackberry annual report below. You can navigate through the pages in the report by either clicking on the pages listed below, or by using the keyword search tool below to find specific information within the annual report.-
 1
1 -
2
-
3
-
4
-
5
-
6
-
7
-
8
-
9
-
10
-
11
-
12
-
13
-
14
-
15
-
16
-
17
-
18
-
19
-
20
-
21
-
22
-
23
-
24
-
25
-
26
-
27
-
28
-
29
-
30
-
31
-
 32
32 -
 33
33 -
 34
34 -
 35
35 -
 36
36 -
 37
37 -
 38
38 -
 39
39 -
 40
40 -
 41
41 -
 42
42 -
 43
43 -
 44
44 -
 45
45 -
 46
46 -
 47
47 -
 48
48 -
 49
49 -
 50
50 -
 51
51 -
 52
52 -
53
-
54
-
55
-
56
-
57
-
58
-
59
-
60
-
61
-
62
-
63
-
64
-
65
-
66
-
67
-
68
-
69
-
70
-
71
-
72
-
73
-
74
-
75
-
76
-
77
-
78
-
79
-
80
-
81
-
82
-
83
-
84
-
85
-
86
-
87
-
88
 |
 |

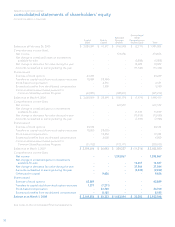
RESEARCH IN MOTION LIMITED
management’s discussion and analysis of financial
condition and results of operations continued
FOR THE THREE MONTHS AND FISCAL YEAR ENDED MARCH 1, 2008
40
Stock Split
The Company declared a 3-for-1 stock split of the Company’s
outstanding common shares on June 28, 2007. The stock split
was implemented by way of a stock dividend. Shareholders
received two common shares of the Company for each
common share held. The stock dividend was paid in the
second quarter of fiscal 2008. All share, earnings per share
and stock option data for the current fiscal year and prior
comparative periods reflects this stock dividend.
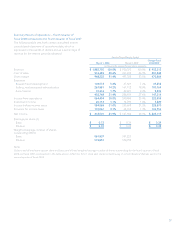
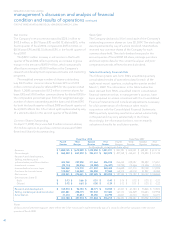
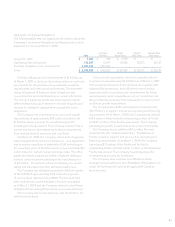
Selected Quarterly Financial Data
The following table sets forth RIM’s unaudited quarterly
consolidated results of operations data for each of the
eight most recent quarters, including the quarter ended
March 1, 2008. The information in the table below has
been derived from RIM’s unaudited interim consolidated
financial statements that, in management’s opinion, have
been prepared on a basis consistent with the Consolidated
Financial Statements and include all adjustments necessary
for a fair presentation of information when read in
conjunction with the Consolidated Financial Statements.
RIM’s quarterly operating results have varied substantially
in the past and may vary substantially in the future.
Accordingly, the information below is not necessarily
indicative of results for any future quarter.
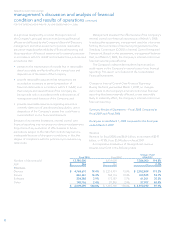
Net Income
The Company’s net income increased by $225.1 million to
$412.5 million, or $0.73 basic EPS and $0.72 diluted EPS, in the
fourth quarter of fiscal 2008, compared to $187.4 million, or
$0.34 basic EPS and $0.33 diluted EPS, in the fourth quarter of
fiscal 2007.
The $225.1 million increase in net income in the fourth
quarter of fiscal 2008 reflects primarily an increase in gross
margin in the amount of $470.9 million, which was partially
offset by an increase of $138.0 million in the Company’s
research and development expenses and sales and marketing
programs.
The weighted average number of shares outstanding
was 561.8 million common shares for basic EPS and 573.9
million common shares for diluted EPS for the quarter ended
March 1, 2008 compared to 557.2 million common shares for
basic EPS and 570.8 million common shares for diluted EPS for
the comparable period last year. Both the weighted average
number of shares outstanding and the basic and diluted EPS
for both the fourth quarter of fiscal 2008 and fourth quarter of
fiscal 2007 reflects the 3-for-1 stock split implemented by way
of a stock dividend in the second quarter of fiscal 2008.
Common Shares Outstanding
On April 11, 2008, there were 563.8 million common shares,
15.3 million options to purchase common shares and 5,000
Restricted Share Units outstanding.
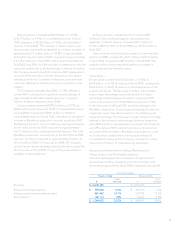
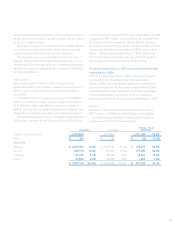
Fiscal Year 2008 Fiscal Year 2007
Fourth
Quarter Third
Quarter Second
Quarter First
Quarter Fourth
Quarter Third
Quarter Second
Quarter First
Quarter
(in thousands, except per share data)
Revenue $ 1,882,705 $ 1,672,529 $ 1,372,250 $ 1,081,911 $ 930,393 $ 835,053 $ 658,541 $ 613,116
Gross margin $ 968,222 $ 847,872 $ 704,417 $ 560,070 $ 497,358 $ 452,631 $ 370,085 $ 337,728
Research and development,
Selling, marketing and
administration,and Amortization 403,768 357,978 311,464 276,212 256,454 228,087 190,582 175,851
Investment income (20,114) (23,816) (18,984) (16,447) (14,794) (12,666) (12,606) (12,051)
Income before income taxes 584,568 513,710 411,937 300,305 255,698 237,210 192,109 173,928
Provision for income taxes 172,067 143,249 124,252 77,085 68,314 62,018 51,957 45,084
Net income $ 412,501 $ 370,461 $ 287,685 $ 223,220 $ 187,384 $ 175,192 $ 140,152 $ 128,844
Earnings per share (1)
Basic $ 0.73 $ 0.66 $ 0.51 $ 0.40 $ 0.34 $ 0.32 $ 0.25 $ 0.23
Diluted $ 0.72 $ 0.65 $ 0.50 $ 0.39 $ 0.33 $ 0.31 $ 0.25 $ 0.22
Research and development $ 104,573 $ 92,150 $ 88,171 $ 74,934 $ 67,321 $ 61,184 $ 55,846 $ 51,822
Selling, marketing and administration 267,881 238,175 197,943 177,483 167,112 146,569 116,283 107,958
Amortization 31,314 27,653 25,350 23,795 22,021 20,334 18,453 16,071
$ 403,768 $ 357,978 $ 311,464 $ 276,212 $ 256,454 $ 228,087 $ 190,582 $ 175,851
Notes:
(1) Basic and diluted earnings per share reflect the 3-for-1 stock split implemented by way of a stock dividend that was paid in the second
quarter of fiscal 2008.