Blackberry 2008 Annual Report Download - page 35
Download and view the complete annual report
Please find page 35 of the 2008 Blackberry annual report below. You can navigate through the pages in the report by either clicking on the pages listed below, or by using the keyword search tool below to find specific information within the annual report.-
 1
1 -
2
-
3
-
4
-
5
-
6
-
7
-
8
-
9
-
10
-
11
-
12
-
13
-
14
-
15
-
16
-
17
-
18
-
19
-
20
-
21
-
22
-
23
-
24
-
 25
25 -
 26
26 -
 27
27 -
 28
28 -
 29
29 -
 30
30 -
 31
31 -
 32
32 -
 33
33 -
 34
34 -
 35
35 -
 36
36 -
 37
37 -
 38
38 -
 39
39 -
 40
40 -
 41
41 -
 42
42 -
 43
43 -
 44
44 -
 45
45 -
46
-
47
-
48
-
49
-
50
-
51
-
52
-
53
-
54
-
55
-
56
-
57
-
58
-
59
-
60
-
61
-
62
-
63
-
64
-
65
-
66
-
67
-
68
-
69
-
70
-
71
-
72
-
73
-
74
-
75
-
76
-
77
-
78
-
79
-
80
-
81
-
82
-
83
-
84
-
85
-
86
-
87
-
88
 |
 |

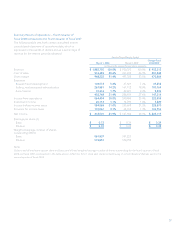
33
common shares for diluted EPS for year ended March 1, 2008
compared to 556.1 million common shares for basic EPS and
571.8 million common shares for diluted EPS for the same
period last year. Both the weighted average number of shares
outstanding and the basic and diluted EPS for year ended
March 1, 2008 and year ended March 3, 2007 reflects the
3-for-1 stock split implemented by way of a stock dividend
that was paid in the second quarter of fiscal 2008.
Fiscal year ended March 3, 2007 compared to the fiscal year
ended March 4, 2006
The fiscal year ended March 3, 2007 comprised 52 weeks
compared to the 53 weeks for the fiscal year ended
March 4, 2006. The consolidated statement of operations
information below for the fiscal year ended March 4, 2006
has been restated. See “Restatement of Previously Issued
Financial Statements” and Note 4 to the consolidated
financial statements for the fiscal year ended March 3, 2007.
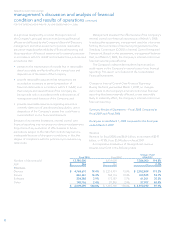
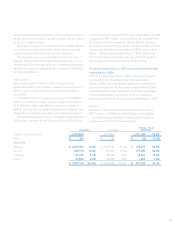
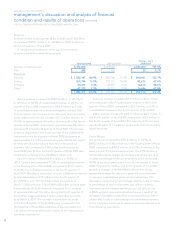
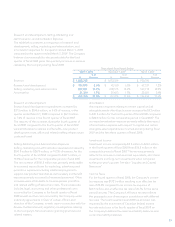
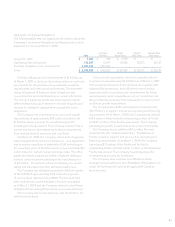
Revenue
Revenue for fiscal 2007 was $3.04 billion, an increase of
$971.3 million, or 47.0%, from $2.07 billion for fiscal 2006.
A comparative breakdown of the significant revenue
streams is set forth in the following table:
denominated assets and liabilities, and the related timing of
these transactions, held by Canadian entities that are subject
to tax in Canadian dollars.
Management expects the Company’s fiscal 2009 effective
tax rate to be approximately 30%, which reflects enacted
future Canadian federal income tax rate reductions.
The Company has not provided for Canadian income
taxes or foreign withholding taxes that would apply on the
distribution of the earnings of its non-Canadian subsidiaries,
as these earnings are intended to be reinvested indefinitely
by these subsidiaries.
Net Income
Net income was $1.29 billion, or $2.31 basic EPS and
$2.26 diluted EPS, in fiscal 2008 compared to net income of
$631.6 million, or $1.14 basic EPS and $1.10 diluted EPS, in
fiscal 2007.
The $662.3 million increase in net income in fiscal 2008
reflects primarily an increase in gross margin in the amount
of $1.42 billion, which was offset in part by an increase of
$467.2 million in the Company’s investments in research and
development expenses and sales and marketing programs.
The weighted average number of shares outstanding was
559.8 million common shares for basic EPS and 572.8 million
Fiscal 2007 Fiscal 2006 Change - Fiscal
2007/2006
Number of devices sold 6,414,000 4,043,000 2,371,000 58.6%
ASP $ 346 $ 356 $ (10) (2.7%)
Revenues
Devices $ 2,215,951 73.0% $ 1,439,674 69.7% $ 776,277 53.9%
Service 560,116 18.4% 383,021 18.5% 177,095 46.2%
Software 173,187 5.7% 156,556 7.6% 16,631 10.6%
Other 87,849 2.9% 86,594 4.2% 1,255 1.4%
$ 3,037,103 100.0% $ 2,065,845 100.0% $ 971,258 47.0%