Blackberry 2008 Annual Report Download - page 36
Download and view the complete annual report
Please find page 36 of the 2008 Blackberry annual report below. You can navigate through the pages in the report by either clicking on the pages listed below, or by using the keyword search tool below to find specific information within the annual report.-
 1
1 -
2
-
3
-
4
-
5
-
6
-
7
-
8
-
9
-
10
-
11
-
12
-
13
-
14
-
15
-
16
-
17
-
18
-
19
-
20
-
21
-
22
-
23
-
24
-
25
-
 26
26 -
 27
27 -
 28
28 -
 29
29 -
 30
30 -
 31
31 -
 32
32 -
 33
33 -
 34
34 -
 35
35 -
 36
36 -
 37
37 -
 38
38 -
 39
39 -
 40
40 -
 41
41 -
 42
42 -
 43
43 -
 44
44 -
 45
45 -
 46
46 -
47
-
48
-
49
-
50
-
51
-
52
-
53
-
54
-
55
-
56
-
57
-
58
-
59
-
60
-
61
-
62
-
63
-
64
-
65
-
66
-
67
-
68
-
69
-
70
-
71
-
72
-
73
-
74
-
75
-
76
-
77
-
78
-
79
-
80
-
81
-
82
-
83
-
84
-
85
-
86
-
87
-
88
 |
 |

RESEARCH IN MOTION LIMITED
management’s discussion and analysis of financial
condition and results of operations continued
FOR THE THREE MONTHS AND FISCAL YEAR ENDED MARCH 1, 2008
34
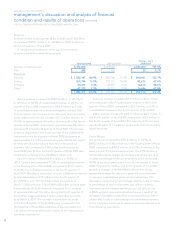
Research and Development
Research and development expenditures increased by
$77.3 million to $236.2 million, or 7.8% of revenue, for fiscal 2007
compared to $158.9 million, or 7.7% of revenue, in fiscal 2006.
The majority of the increases during fiscal 2007 when compared
to fiscal 2006 were attributable to salaries and benefits, third
party new product development costs, travel and office
expenses as well as related staffing infrastructure costs.
Device revenue increased by $776.3 million, or 53.9%, to
$2.22 billion, or 73.0% of consolidated revenue in fiscal 2007
compared to $1.44 billion, or 69.7% of consolidated revenue
in fiscal 2006. This increase in device revenue over the prior
year’s period is primarily attributable to a volume increase
of 2.4 million devices, or 58.6%, to approximately 6.4 million
devices sold in fiscal 2007 compared to approximately
4.0 million devices sold in fiscal 2006, partially offset by a
decrease of $10, or 2.7%, in ASP to $346 in the current fiscal
period from $356 in fiscal 2006. This decrease of $10 in ASP is
due primarily to a change in BlackBerry device mix in fiscal 2007.
Service revenue increased by $177.1 million, or 46.2%,
to $560.1 million and comprised 18.4% of consolidated
revenue in fiscal 2007 compared to $383.0 million, or 18.5%
of consolidated revenue, in fiscal 2006. BlackBerry subscriber
account additions were approximately net 3.1 million for
fiscal 2007 compared to approximately net 2.3 million for the
comparable period last year. The total BlackBerry subscriber
account base at the end of fiscal 2007 was approximately 8
million compared to 4.9 million at the end of fiscal 2006.
Software revenue increased $16.6 million, or 10.6%, to
$173.2 million in fiscal 2007 from $156.6 million in fiscal 2006,
primarily as a result of increased sales of CALs as well as
increased revenues from technical support and maintenance.
Other revenue increased marginally by $1.2 million to
$87.8 million in fiscal 2007 compared to $86.6 million in fiscal 2006.
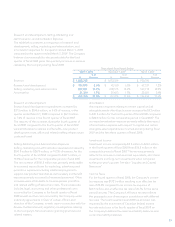
Gross Margin
Gross margin increased by $517.6 million, or 45.4 %, to
$1.66 billion, or 54.6% of revenue, in fiscal 2007, compared to
$1.14 billion, or 55.2% of revenue, in the previous fiscal year.
The net decrease of 0.6% in consolidated gross margin
percentage was primarily due to the higher percentage of
device shipments which comprised 73.0% of the total revenue
mix for fiscal 2007 compared to 69.7% in the comparable
period of fiscal 2006 as well as changes in BlackBerry device
mix. The decrease in gross margin percentage relating to the
increase in percentage of device shipments was offset in part
by improved service margins resulting from cost efficiencies
in RIM’s network operations infrastructure as a result of the
increase in BlackBerry subscriber accounts and a decline in
certain fixed costs as a percentage of consolidated revenue
as the Company continues to realize economies of scale in its
manufacturing operations.
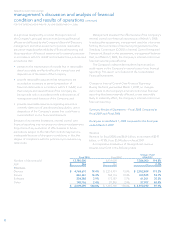
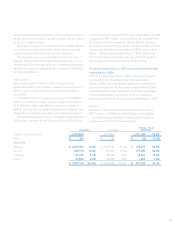
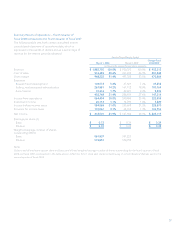
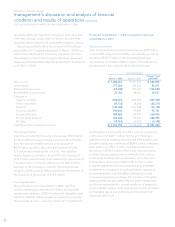
Research and Development, Selling, Marketing and
Administration, and Amortization Expense
The table below presents a comparison of research and
development, selling, marketing and administration, and
amortization expenses for fiscal 2007 compared to fiscal 2006.
Fiscal Year Ended
March 3, 2007 March 4, 2006
$% of
Revenue $% of
Revenue
Revenue $ 3,037,103 $ 2,065,845
Research and development $ 236,173 7.8% $ 158,887 7.7%
Selling, marketing and administration 537,922 17.7% 314,317 15.2%
Amortization 76,879 2.5% 49,951 2.4%
$ 850,974 28.0% $ 523,155 25.3%
Selling, Marketing and Administration Expenses
Selling, marketing and administrative expenses increased by
$223.6 million to $537.9 million, or 17.7% of revenue, during
the current fiscal year compared to $314.3 million or 15.2%
of revenue, for the comparable period in fiscal 2006. The
net increase of $223.6 million was primarily attributable
to increased expenditures for marketing, advertising and
promotion expenses, salary and benefit expense, consulting