Blackberry 2002 Annual Report Download - page 33
Download and view the complete annual report
Please find page 33 of the 2002 Blackberry annual report below. You can navigate through the pages in the report by either clicking on the pages listed below, or by using the keyword search tool below to find specific information within the annual report.-
 1
1 -
2
-
3
-
4
-
5
-
6
-
7
-
8
-
9
-
10
-
11
-
12
-
13
-
14
-
15
-
16
-
17
-
18
-
19
-
20
-
21
-
22
-
 23
23 -
 24
24 -
 25
25 -
 26
26 -
 27
27 -
 28
28 -
 29
29 -
 30
30 -
 31
31 -
 32
32 -
 33
33 -
 34
34 -
 35
35 -
 36
36 -
 37
37 -
 38
38 -
 39
39 -
 40
40
 |
 |
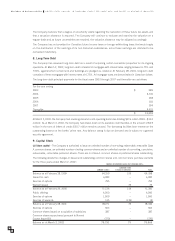
While the Company sells to a variety of customers, two customers comprised 16% and 15% of trade receivables as
at March 2, 2002 (2001 – one customer comprised 25%). Additionally, two customers comprised 17% and 11% of
the Company’s sales (2001 – one customer comprised 18%).
For certain of the Company’s financial instruments, including trade receivables, other receivables, accounts payable
and accrued liabilities, the carrying amounts approximate their respective fair values due to their short maturities.
Cash and cash equivalents, marketable securities and long-term debt are carried at cost, which approximates their
respective fair values.
16. Segment Disclosures
The Company is organized and managed as a single reportable business segment. The Company’s operations
are substantially all related to the research, design, manufacture and sales of wireless communications products.
Selected financial information is as follows:
MARCH 2, 2002 FEBRUARY 28, 2001 FEBRUARY 29, 2000
Sales
Canada $ 21,381 $ 16,721 $ 6,187
United States 239,702 204,606 78,780
Foreign 32,970 ––
$ 294,053 $ 221,327 $ 84,967
Sales
Canada 7.3% 7.6% 7.3%
United States 81.5% 92.4% 92.7%
Foreign 11.2% ––
100.0% 100.0% 100.0%
Revenue mix
Handhelds and other hardware products $ 180,372 $ 174,750 $ 74,817
Service 88,880 29,067 2,208
Software, non-recurring engineering and other 24,801 17,510 7,942
$ 294,053 $ 221,327 $ 84,967
Capital and intangible assets
Canada $ 175,406 $ 89,966
United States 651 –
Foreign 6,184 5,242
$ 182,241 $ 95,208
Total assets
Canada $ 290,133 $ 246,446
United States 631,126 717,744
Foreign 26,898 5,873
$ 948,157 $ 970,063
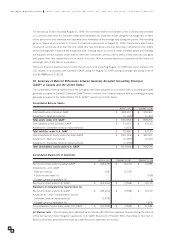
17. Comparative Figures
Certain of the prior years’ figures have been reclassified for consistency with the current presentation.
The Company historically measured and presented its financial statements in Canadian dollars. Effective September 1,
1999, as a result of the Company’s increased economic activity in the United States (“U.S.”), the U.S. dollar became
the functional currency of the Company’s operations and for the financial statements of the Company. Effective the
same date, the U.S. dollar was adopted as the reporting currency.
FOR THE YEARS ENDED MARCH 2, 2002, FEBRUARY 28, 2001 AND FEBRUARY 29, 2000
1
3