Blackberry 2002 Annual Report Download - page 21
Download and view the complete annual report
Please find page 21 of the 2002 Blackberry annual report below. You can navigate through the pages in the report by either clicking on the pages listed below, or by using the keyword search tool below to find specific information within the annual report.-
 1
1 -
2
-
3
-
4
-
5
-
6
-
7
-
8
-
9
-
10
-
 11
11 -
 12
12 -
 13
13 -
 14
14 -
 15
15 -
 16
16 -
 17
17 -
 18
18 -
 19
19 -
 20
20 -
 21
21 -
 22
22 -
 23
23 -
 24
24 -
 25
25 -
 26
26 -
 27
27 -
 28
28 -
 29
29 -
 30
30 -
 31
31 -
32
-
33
-
34
-
35
-
36
-
37
-
38
-
39
-
40
 |
 |
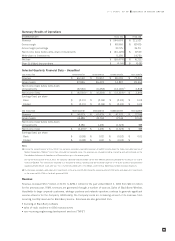
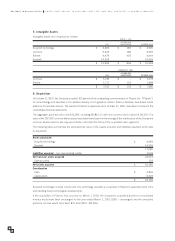
CONSOLIDATED STATEMENTS OF CASH FLOWS
FOR THE YEAR ENDED MARCH 2, 2002 FEBRUARY 28, 2001,FEBRUARY 29, 2000
Cash flows from operating activities
Net income (loss) $ (28,479) $ (6,211) $ 10,498
Items not requiring an outlay of cash:
Amortization 17,740 9,123 4,683
Future income taxes (16,921) 5,011 3,650
Non-cash transaction ––(3,000)
Write-down of investments 5,350 14,750 –
Foreign exchange gain (loss) 4(8) (162)
(22,306) 22,665 15,669
Net changes in non-cash working capital items:
Trade receivables 7,607 (23,029) (16,110)
Other receivables 7,918 (7,859) (4,649)
Inventory 30,567 (31,192) (17,040)
Prepaid expenses and other (3,467) (17,730) 931
Accounts payable and accrued liabilities (499) 34,859 3,269
Income taxes payable (1,018) 2,027 (2,679)
Deferred revenue (1,097) 4,593 4,862
17,705 (15,666) (15,747)
Cash flows from financing activities
Issuance of share capital and warrants 1,491 615,551 198,535
Financing costs, net of income tax benefits –(30,462) (9,065)
Buyback of common shares pursuant to Normal Course Issuer Bid (note 9[a])
(5,525) ––
Repayment of debt (303) (185) (15)
(4,337) 584,904 189,455
Cash flows from investing activities
Acquisition of capital assets (73,917) (59,058) (21,597)
Acquisition of intangible assets (7,106) (6,503) (645)
Acquisition of subsidiary (note 6) (9,709) ––
Acquisition of marketable securities (925,885) (388,672) (259,968)
Proceeds on sale and maturity of marketable securities 834,907 393,683 98,848
(181,710) (60,550) (183,362)
Foreign exchange effect on cash and cash equivalents (4) 8162
Net increase (decrease) in cash and cash equivalents for the year (168,346) 508,696 (9,492)
Cash and cash equivalents, beginning of year 508,822 126 9,618
Cash and cash equivalents, end of year $ 340,476 $ 508,822 $ 126
See notes to the consolidated financial statements.
FOR THE YEARS ENDED MARCH 2, 2002, FEBRUARY 28, 2001 AND FEBRUARY 29, 2000
9
1