Blackberry 2002 Annual Report Download - page 15
Download and view the complete annual report
Please find page 15 of the 2002 Blackberry annual report below. You can navigate through the pages in the report by either clicking on the pages listed below, or by using the keyword search tool below to find specific information within the annual report.-
 1
1 -
2
-
3
-
4
-
 5
5 -
 6
6 -
 7
7 -
 8
8 -
 9
9 -
 10
10 -
 11
11 -
 12
12 -
 13
13 -
 14
14 -
 15
15 -
 16
16 -
 17
17 -
 18
18 -
 19
19 -
 20
20 -
 21
21 -
 22
22 -
 23
23 -
 24
24 -
 25
25 -
26
-
27
-
28
-
29
-
30
-
31
-
32
-
33
-
34
-
35
-
36
-
37
-
38
-
39
-
40
 |
 |

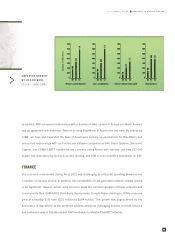
Income Taxes
The Company’s fiscal 2002 consolidated net effective tax rate was 25.7% and was materially affected by the impact of:
• the write-down of investments, which was not tax effected. The Company’s fiscal 2002 consolidated net effective
tax rate, after accounting for the effect of this $5.4 million write-down, would have been 29.9%. For tax purposes
the write-down would be characterized as a capital loss. The Company determined that it should record valuation
allowances against the tax recoveries booked on the capital losses because management determined that it was
more likely than not that the Company would not be able to utilize this capital loss carryforward, and
• varying tax rates in different foreign jurisdictions.
Net Loss
Net loss was $28.5 million in fiscal 2002 versus $6.2 million in the prior year. Net loss for the year ended March 2,
2002, before the write-down of investments of $5.4 million, was $23.1 million compared to prior year’s net income
of $8.5 million before the write-down of investments of $14.8 million.
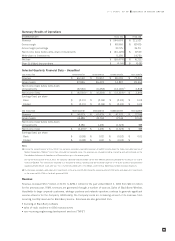
Liquidity and Capital Resources
Cash flows generated from operating activities were $17.7 million in the current fiscal year compared to cash flow used in
operating activities of $15.7 million in the prior year, an improvement of $33.4 million. The primary factor was a significant
reduction in trade receivables, other receivables and inventory during 2002, as summarized in the following table:
AS AT MARCH 2, 2002 FEBRUARY 28, 2001 REDUCTION
Trade receivables $ 42,642 $ 50,268 $ (7,626)
Other receivables 5,976 13,894 (7,918)
Inventories $ 37,477 $ 68,044 $ (30,567)
Cash flows used in financing activities were $4.3 million for the current year, including the buyback of common shares
of $5.5 million pursuant to the Company’s Normal Course Issuer Bid. Cash flows from financing activities for fiscal 2001
were $584.9 million, including net proceeds after costs of $580.2 million from the public offering of six million common
shares in October 2000.
Cash flows used in investing activities were $181.7 million for the year ended March 2, 2002, including capital and
intangible asset expenditures of $73.9 million and $7.1 million respectively, the acquisition of Plazmic Inc. for the net
cash consideration portion of $9.7 million and the net acquisition of marketable securities of $91.0 million. Cash
flows used in investing activities for the year ended February 28, 2001 were $60.6 million which included capital and
intangible asset expenditures of $65.6 million less the net disposition of marketable securities of $5.0 million.
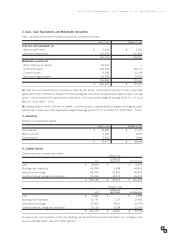
Cash, cash equivalents and marketable securities decreased by $77.4 million to $644.6 million as at March 2, 2002
from $721.9 million as at February 28, 2001. A comparative summary is set out below.
AS AT MARCH 2, 2002 FEBRUARY 28, 2001 CHANGE
Cash and cash equivalents $ 340,476 $ 508,822 $ (168,346)
Marketable securities 304,083 213,105 90,978
Cash, cash equivalents and marketable securities $ 644,559 $ 721,927 $ (77,368)
Market Risk of Financial Instruments
The Company is engaged in operating and financing activities that generate risk in three primary areas:
Foreign Exchange
The majority of the Company’s revenues are transacted in U.S. dollars and British pounds sterling. Purchases of raw
materials are primarily transacted in U.S. dollars. Certain other expenses, consisting of salaries, operating costs and
manufacturing overhead, are incurred primarily in Canadian dollars. The Company is exposed to foreign exchange
risk as a result of transactions in currencies other than its functional currency of the U.S. dollar. These foreign currencies
include the Canadian Dollar, British Pound, Euro and Japanese Yen. To mitigate the risks relating to foreign exchange
fluctuations, the Company maintains net monetary asset and/or liability balances in foreign currencies and engages in
foreign currency hedging activities through the utilization of derivative financial instruments. The Company does not
purchase or hold any derivative instruments for speculative purposes.
2002 ANNUAL REPORT RESEARCH IN MOTION LIMITED
3
1