Blackberry 2002 Annual Report Download - page 3
Download and view the complete annual report
Please find page 3 of the 2002 Blackberry annual report below. You can navigate through the pages in the report by either clicking on the pages listed below, or by using the keyword search tool below to find specific information within the annual report.-
 1
1 -
 2
2 -
 3
3 -
 4
4 -
 5
5 -
 6
6 -
 7
7 -
 8
8 -
 9
9 -
 10
10 -
 11
11 -
 12
12 -
 13
13 -
 14
14 -
15
-
16
-
17
-
18
-
19
-
20
-
21
-
22
-
23
-
24
-
25
-
26
-
27
-
28
-
29
-
30
-
31
-
32
-
33
-
34
-
35
-
36
-
37
-
38
-
39
-
40
 |
 |
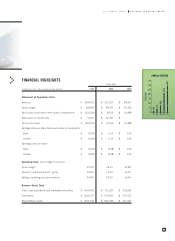
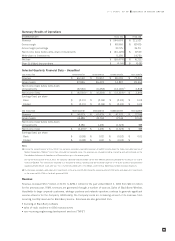
2002 ANNUAL REPORT RESEARCH IN MOTION LIMITED
FINANCIAL HIGHLIGHTS
FISCAL YEAR
(in thousands of U.S. dollars, except per share amounts) 2002 2001 2000
Statement of Operations Data
Revenue $ 294,053 $ 221,327 $ 84,967
Gross margin $ 98,560 $ 87,475 $ 36,393
Net income (loss) before write-down of investments $ (23,129) $ 8,539 $ 10,498
Write-down of investments $5,350 $ 14,750 $ –
Net income (loss) $ (28,479) $ (6,211) $ 10,498
Earnings (loss) per share before write-down of investments
Basic $ (0.29) $0.12$ 0.16
Diluted $ (0.29) $0.12$ 0.14
Earnings (loss) per share
Basic $ (0.36) $ (0.08) $ 0.16
Diluted $ (0.36) $ (0.08) $ 0.14
Operating Data (percentage of revenue)
Gross margin 33.5% 39.5% 42.8%
Research and development –gross 16.8% 11.6% 14.4%
Selling, marketing and administration 34.8% 29.5% 16.4%
Balance Sheet Data
Cash, cash equivalents and marketable securities $ 644,559 $ 721,927 $ 218,242
Total assets $ 948,157 $ 970,063 $ 337,227
Shareholders’ equity $876,745 $ 902,933 $ 311,391
>
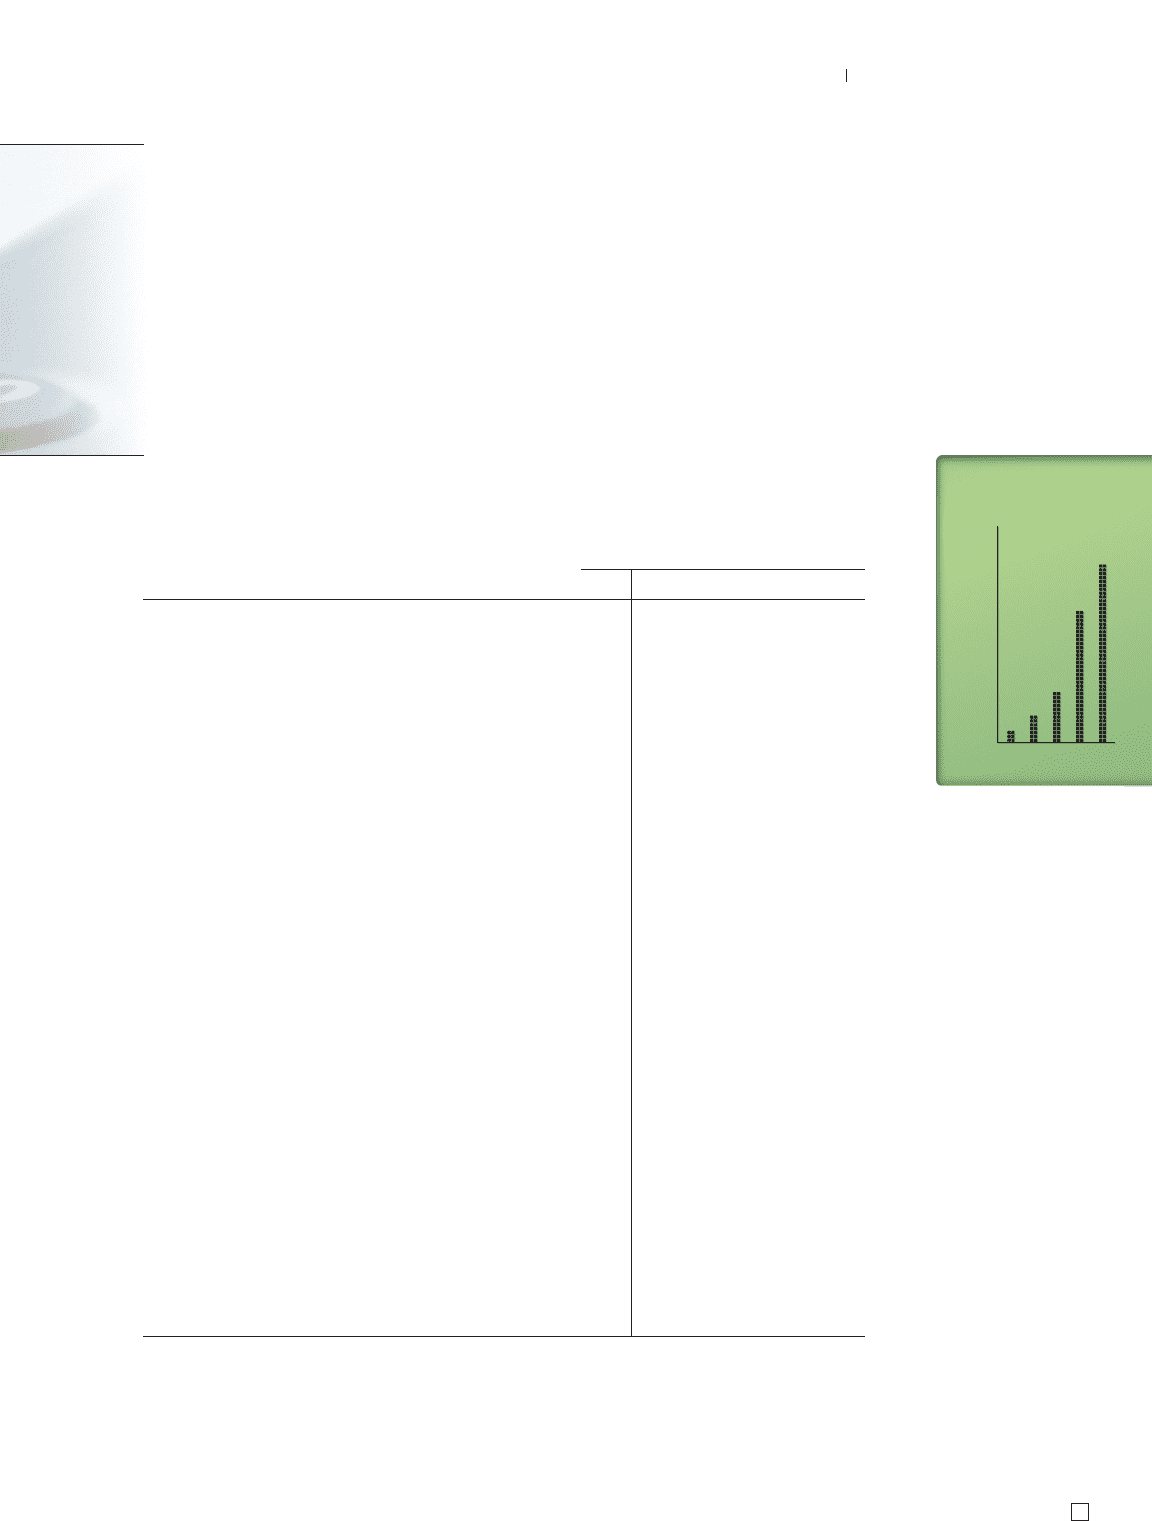
98 99 00 01 02
350
300
250
200
150
100
50
0
294.1
221.3
85.0
47.3
20.9
ANNUAL REVENUE
$ MILLIONS
98 99 00 01 02
350
300
250
200
150
100
50
0
294.1
221.3
85.0
47.3
20.9
ANNUAL REVENUE
$ MILLIONS
1