Bed, Bath and Beyond 2012 Annual Report Download - page 9
Download and view the complete annual report
Please find page 9 of the 2012 Bed, Bath and Beyond annual report below. You can navigate through the pages in the report by either clicking on the pages listed below, or by using the keyword search tool below to find specific information within the annual report.-
 1
1 -
 2
2 -
 3
3 -
 4
4 -
 5
5 -
 6
6 -
 7
7 -
 8
8 -
 9
9 -
 10
10 -
 11
11 -
 12
12 -
 13
13 -
 14
14 -
 15
15 -
 16
16 -
 17
17 -
 18
18 -
 19
19 -
 20
20 -
21
-
22
-
23
-
24
-
25
-
26
-
27
-
28
-
29
-
30
-
31
-
32
-
33
-
34
-
35
-
36
-
37
-
38
-
39
-
40
-
41
-
42
-
43
-
44
-
45
-
46
-
47
-
48
-
49
-
50
-
51
-
52
-
53
-
54
-
55
-
56
-
57
-
58
-
59
-
60
-
61
-
62
-
63
-
64
-
65
-
66
-
67
-
68
-
69
-
70
-
71
-
72
-
73
-
74
-
75
-
76
 |
 |
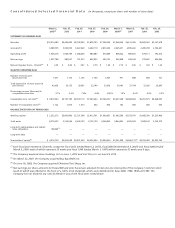
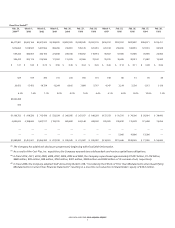
Net Sales
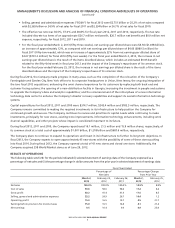
Net sales in fiscal 2012 (fifty-three weeks) increased $1.415 billion to $10.915 billion, representing an increase of 14.9% over
$9.500 billion of net sales in fiscal 2011 (fifty-two weeks), which increased $741.4 million or 8.5% over the $8.759 billion of net
sales in fiscal 2010 (fifty-two weeks). For fiscal 2012, approximately 58% of the increase in net sales was attributable to the
inclusion of World Market and Linen Holdings since the date of each respective acquisition through the end of the fiscal fifty-
second week, approximately 13% of the increase was attributable to the fifty-third week including World Market and Linen
Holdings, approximately 18% was attributable to an increase in the Company’s comparable store sales and the remaining 11%
of the increase was primarily attributable to an increase in the Company’s new store sales. For fiscal 2011, approximately
68.6% of the increase in net sales was attributable to an increase in the Company’s comparable store sales and the balance of
the increase was primarily attributable to an increase in the Company’s new store sales.
For fiscal 2012, comparable store sales for 1,122 stores represented $9.820 billion of net sales; for fiscal 2011, comparable store
sales for 1,076 stores represented $9.157 billion of net sales; and for fiscal 2010, comparable store sales for 1,013 stores
represented $8.339 billion of net sales. The number of stores includes only those which constituted a comparable store for the
entire respective fiscal period. The increase in comparable store sales, which excludes World Market and Linen Holdings, was
approximately 2.7% for fiscal 2012, as compared with an increase of approximately 5.9% for fiscal 2011. The increase in
comparable store sales for fiscal 2012 was due to an increase in the average transaction amount partially offset by a decrease
in the number of transactions. The increase in comparable store sales for fiscal 2011 was due to increases in both the number
of transactions and the average transaction amount. Comparable store sales percentages are calculated based on an
equivalent number of weeks for each annual period.
Sales of domestics merchandise accounted for approximately 39%, 40% and 41% of net sales in fiscal 2012, 2011 and 2010,
respectively, of which the Company estimates that bed linens accounted for approximately 12% of net sales in fiscal 2012, 2011
and 2010, respectively. The remaining net sales in fiscal 2012, 2011 and 2010 of 61%, 60% and 59%, respectively, represented
sales of home furnishings. No other individual product category accounted for 10% or more of net sales during fiscal 2012,
2011 or 2010.
Gross Profit
Gross profit in fiscal 2012, 2011 and 2010 was $4.389 billion or 40.2% of net sales, $3.931 billion or 41.4% of net sales and
$3.623 billion or 41.4% of net sales, respectively. The decrease in the gross profit margin as a percentage of net sales between
fiscal 2012 and 2011 was primarily attributed to an increase in coupons, due to increases in both the redemption and the
average coupon amount, and a shift in the mix of merchandise sold to lower margin categories. The gross profit margin as a
percentage of net sales for fiscal 2011 included a reduction in markdowns, offset by an increase in inventory acquisition costs
and a shift in the mix of merchandise sold to lower margin categories.
Selling, General and Administrative Expenses
SG&A was $2.751 billion or 25.2% of net sales in fiscal 2012, $2.363 billion or 24.9% of net sales in fiscal 2011 and $2.334
billion or 26.7% of net sales in fiscal 2010. The increase in SG&A between fiscal 2012 and 2011 as a percentage of net sales was
primarily due to a relative increase in advertising expenses. As a percentage of net sales, the relative increase in advertising
expenses was higher due to the inclusion of the financial results of the acquisitions completed in fiscal 2012. In addition, the
fifty-third week has relatively higher SG&A than the year to date fifty-two weeks and increased SG&A by approximately 10
basis points. The decrease in SG&A between fiscal 2011 and 2010 as a percentage of net sales was primarily due to relative
decreases in payroll and payroll-related items (including salaries and medical insurance), occupancy (including rent and
depreciation), advertising and store expenses, all of which benefited from the increase in comparable store sales. In addition,
advertising expenses as a percentage of net sales benefited from a reduction in the mailing of advertising pieces.
Operating Profit
Operating profit for fiscal 2012 was $1.638 billion or 15.0% of net sales, $1.568 billion or 16.5% of net sales in fiscal 2011 and
$1.288 billion or 14.7% of net sales in fiscal 2010. The change in operating profit as a percentage of net sales between fiscal
2012 and 2011 was the result of the changes in gross profit margin and SG&A as a percentage of net sales as described above.
The change in operating profit as a percentage of net sales between fiscal 2011 and 2010 was the result of the change in
SG&A as a percentage of net sales as described above.
BED BATH & BEYOND 2012 ANNUAL REPORT
7