Bed, Bath and Beyond 2012 Annual Report Download - page 11
Download and view the complete annual report
Please find page 11 of the 2012 Bed, Bath and Beyond annual report below. You can navigate through the pages in the report by either clicking on the pages listed below, or by using the keyword search tool below to find specific information within the annual report.-
 1
1 -
 2
2 -
 3
3 -
 4
4 -
 5
5 -
 6
6 -
 7
7 -
 8
8 -
 9
9 -
 10
10 -
 11
11 -
 12
12 -
 13
13 -
 14
14 -
 15
15 -
 16
16 -
 17
17 -
 18
18 -
 19
19 -
 20
20 -
 21
21 -
 22
22 -
23
-
24
-
25
-
26
-
27
-
28
-
29
-
30
-
31
-
32
-
33
-
34
-
35
-
36
-
37
-
38
-
39
-
40
-
41
-
42
-
43
-
44
-
45
-
46
-
47
-
48
-
49
-
50
-
51
-
52
-
53
-
54
-
55
-
56
-
57
-
58
-
59
-
60
-
61
-
62
-
63
-
64
-
65
-
66
-
67
-
68
-
69
-
70
-
71
-
72
-
73
-
74
-
75
-
76
 |
 |
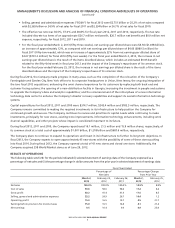
Fiscal 2012 compared to Fiscal 2011
Net cash provided by operating activities in fiscal 2012 was $1.193 billion, compared with $1.225 billion in fiscal 2011. Year
over year, the Company experienced an increase in cash used by the net components of working capital (primarily merchandise
inventories, other current assets and accrued expenses and other current liabilities, partially offset by accounts payable and
income taxes payable) and an increase in net earnings.
Retail inventory at cost per square foot was $58.12 as of March 2, 2013, as compared to $57.35 as of February 25, 2012.
Net cash used in investing activities in fiscal 2012 was $665.8 million, compared with $364.0 million in fiscal 2011. In fiscal 2012,
net cash used in investing activities was due to payments of $643.1 million related to the World Market and Linen Holdings
acquisitions, $314.7 million for capital expenditures and $40.0 million for the acquisition of trademarks, partially offset by
redemptions of $332.0 million of investment securities, net of purchases. In fiscal 2011, net cash used in investing activities was
due to $243.4 million of capital expenditures and $120.6 million of purchases of investment securities, net of redemptions.
Net cash used in financing activities for fiscal 2012 was $965.4 million, compared with $1.042 billion in fiscal 2011. The
decrease in net cash used was primarily due to a decrease in common stock repurchases of $216.7 million, partially offset by a
$114.7 million decrease in cash proceeds from the exercise of stock options and a $25.5 million payment for a credit facility
assumed in acquisition.
Fiscal 2011 compared to Fiscal 2010
Net cash provided by operating activities in fiscal 2011 was $1.225 billion, compared with $987.4 million in fiscal 2010. Year-
over-year, the Company experienced an increase in net earnings, partially offset by an increase in cash used for the net
components of working capital (primarily accounts payable and income taxes payable, partially offset by merchandise
inventories).
Inventory per square foot was $57.35 as of February 25, 2012, as compared to $56.17 as of February 26, 2011.
Net cash used in investing activities in fiscal 2011 was $364.0 million, compared with $341.0 million in fiscal 2010. In fiscal 2011,
net cash used in investing activities was due to $243.4 million of capital expenditures and $120.6 million of purchases of
investment securities, net of redemptions. In fiscal 2010, net cash used in investing activities was due to $157.5 million of
purchases of investment securities, net of redemptions, and $183.5 million of capital expenditures.
Net cash used in financing activities for fiscal 2011 was $1.042 billion, compared with $559.0 million in fiscal 2010. The increase
in net cash used was primarily due to a $530.4 million increase in common stock repurchases partially offset by a $45.4 million
increase in cash proceeds from the exercise of stock options.
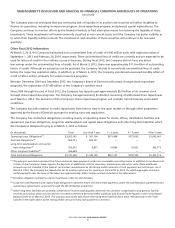
Auction Rate Securities
As of March 2, 2013, the Company held approximately $49.0 million of net investments in auction rate securities. Beginning in
mid-February 2008, the auction process for the Company’s auction rate securities failed and continues to fail. These failed
auctions result in a lack of liquidity in the securities but do not affect the underlying collateral of the securities. All of these
investments carry triple-A credit ratings from one or more of the major credit rating agencies. As of March 2, 2013, these
securities had a temporary valuation adjustment of approximately $2.0 million to reflect their current lack of liquidity. Since
this valuation adjustment is deemed to be temporary, it was recorded in accumulated other comprehensive loss, net of a
related tax benefit, and did not affect the Company’s net earnings for fiscal 2012.
During fiscal 2012, approximately $8.5 million of auction rate securities were redeemed at par and approximately $24.3 million
were tendered at a price of approximately 95% of par value, for which the Company incurred a realized loss of approximately
$1.1 million included within interest (expense) income, net in the consolidated statement of earnings for fiscal 2012. Prior to
these tenders, all redemptions of these securities had been at par. The Company will continue to monitor the market for these
securities and will expense any permanent changes to the value of the remaining securities, if any, as they occur.
BED BATH & BEYOND 2012 ANNUAL REPORT
9