Bed, Bath and Beyond 2012 Annual Report Download - page 35
Download and view the complete annual report
Please find page 35 of the 2012 Bed, Bath and Beyond annual report below. You can navigate through the pages in the report by either clicking on the pages listed below, or by using the keyword search tool below to find specific information within the annual report.-
 1
1 -
2
-
3
-
4
-
5
-
6
-
7
-
8
-
9
-
10
-
11
-
12
-
13
-
14
-
15
-
16
-
17
-
18
-
19
-
20
-
21
-
22
-
23
-
24
-
 25
25 -
 26
26 -
 27
27 -
 28
28 -
 29
29 -
 30
30 -
 31
31 -
 32
32 -
 33
33 -
 34
34 -
 35
35 -
 36
36 -
 37
37 -
 38
38 -
 39
39 -
 40
40 -
 41
41 -
 42
42 -
 43
43 -
 44
44 -
 45
45 -
46
-
47
-
48
-
49
-
50
-
51
-
52
-
53
-
54
-
55
-
56
-
57
-
58
-
59
-
60
-
61
-
62
-
63
-
64
-
65
-
66
-
67
-
68
-
69
-
70
-
71
-
72
-
73
-
74
-
75
-
76
 |
 |

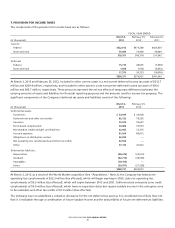
Stock-based compensation expense for the fiscal year ended March 2, 2013, February 25, 2012 and February 26, 2011 was
approximately $47.2 million ($30.0 million after tax or $0.13 per diluted share), $45.2 million ($28.5 million after tax or $0.12
per diluted share) and approximately $44.3 million ($27.1 million after tax or $0.10 per diluted share), respectively. In addition,
the amount of stock-based compensation cost capitalized for each of the years ended March 2, 2013 and February 25, 2012
was approximately $1.3 million.
Incentive Compensation Plans
During fiscal 2012, the Company adopted the Bed Bath & Beyond 2012 Incentive Compensation Plan (the ‘‘2012 Plan’’), which
amended and restated the Bed Bath & Beyond 2004 Incentive Compensation Plan (the ‘‘2004 Plan’’). The 2012 Plan generally
incorporates the provisions of the 2004 Plan and also includes an increase in the aggregate number of common shares
authorized for issuance by 14.3 million shares for a total of 43.2 million shares authorized for issuance and the ability to grant
incentive stock options. Outstanding awards that were covered by the 2004 Plan will continue to be in effect under the
2012 Plan.
The 2012 Plan is a flexible compensation plan that enables the Company to offer incentive compensation through stock
options (whether nonqualified stock options or incentive stock options), restricted stock awards, stock appreciation rights,
performance awards and other stock based awards, including cash awards. Under the 2012 Plan, grants are determined by the
Compensation Committee for those awards granted to executive officers and by an appropriate committee for all other
awards granted. Awards of stock options and restricted stock generally vest in five equal annual installments beginning one to
three years from the date of grant.
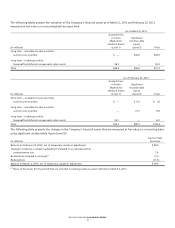
The Company generally issues new shares for stock option exercises and restricted stock awards. As of March 2, 2013,
unrecognized compensation expense related to the unvested portion of the Company’s stock options and restricted stock
awards was $23.5 million and $115.4 million, respectively, which is expected to be recognized over a weighted average period
of 2.8 years and 3.6 years, respectively.
Stock Options
Stock option grants are issued at fair market value on the date of grant and generally become exercisable in either three or
five equal annual installments beginning one year from the date of grant for options issued since May 10, 2010, and beginning
one to three years from the date of grant for options issued prior to May 10, 2010, in each case, subject, in general to the
recipient remaining in the Company’s employ or service on specified vesting dates. Option grants expire eight years after the
date of grant for stock options issued since May 10, 2004, and expire ten years after the date of grant for stock options issued
prior to May 10, 2004. All option grants are nonqualified.
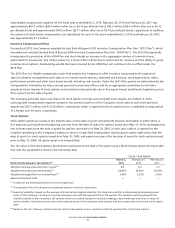
The fair value of the stock options granted was estimated on the date of the grant using a Black-Scholes option-pricing model
that uses the assumptions noted in the following table.
FISCAL YEAR ENDED
Black-Scholes Valuation Assumptions
(1)
March 2,
2013
February 25,
2012
February 26,
2011
Weighted Average Expected Life (in years)
(2)
6.5 6.2 6.1
Weighted Average Expected Volatility
(3)
31.07% 30.59% 33.70%
Weighted Average Risk Free Interest Rates
(4)
1.14% 2.34% 2.56%
Expected Dividend Yield ———
(1)
Forfeitures are estimated based on historical experience.
(2)
The expected life of stock options is estimated based on historical experience.
(3)
Expected volatility is based on the average of historical and implied volatility. The historical volatility is determined by observing actual
prices of the Company’s stock over a period commensurate with the expected life of the awards. The implied volatility represents the
implied volatility of the Company’s call options, which are actively traded on multiple exchanges, had remaining maturities in excess of
twelve months, had market prices close to the exercise prices of the employee stock options and were measured on the stock option grant
date.
(4)
Based on the U.S. Treasury constant maturity interest rate whose term is consistent with the expected life of the stock options.
BED BATH & BEYOND 2012 ANNUAL REPORT
33