Bed, Bath and Beyond 2012 Annual Report Download - page 28
Download and view the complete annual report
Please find page 28 of the 2012 Bed, Bath and Beyond annual report below. You can navigate through the pages in the report by either clicking on the pages listed below, or by using the keyword search tool below to find specific information within the annual report.-
 1
1 -
2
-
3
-
4
-
5
-
6
-
7
-
8
-
9
-
10
-
11
-
12
-
13
-
14
-
15
-
16
-
17
-
 18
18 -
 19
19 -
 20
20 -
 21
21 -
 22
22 -
 23
23 -
 24
24 -
 25
25 -
 26
26 -
 27
27 -
 28
28 -
 29
29 -
 30
30 -
 31
31 -
 32
32 -
 33
33 -
 34
34 -
 35
35 -
 36
36 -
 37
37 -
 38
38 -
39
-
40
-
41
-
42
-
43
-
44
-
45
-
46
-
47
-
48
-
49
-
50
-
51
-
52
-
53
-
54
-
55
-
56
-
57
-
58
-
59
-
60
-
61
-
62
-
63
-
64
-
65
-
66
-
67
-
68
-
69
-
70
-
71
-
72
-
73
-
74
-
75
-
76
 |
 |
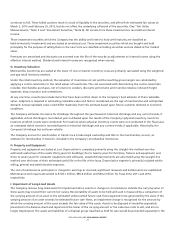
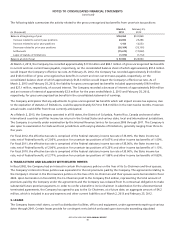
4. LINES OF CREDIT
At March 2, 2013, the Company maintained two uncommitted lines of credit of $100 million each, with expiration dates of
September 1, 2013 and February 28, 2014, respectively. These uncommitted lines of credit are currently and are expected to be
used for letters of credit in the ordinary course of business. During fiscal 2012 and 2011, the Company did not have any direct
borrowings under the uncommitted lines of credit. As of March 2, 2013, there was approximately $11.6 million of outstanding
letters of credit. Although no assurances can be provided, the Company intends to renew both uncommitted lines of credit
before the respective expiration dates. In addition, as of March 2, 2013, the Company maintained unsecured standby letters of
credit of $76.2 million, primarily for certain insurance programs. As of February 25, 2012, there was approximately $8.5 million
of outstanding letters of credit and approximately $61.3 million of outstanding unsecured standby letters of credit, primarily
for certain insurance programs.
5. FAIR VALUE MEASUREMENTS
Fair value is defined as the price that would be received to sell an asset or paid to transfer a liability (i.e., ‘‘the exit price’’) in an
orderly transaction between market participants at the measurement date. In determining fair value, the Company uses
various valuation approaches, including quoted market prices and discounted cash flows. The hierarchy for inputs used in
measuring fair value maximizes the use of observable inputs and minimizes the use of unobservable inputs by requiring that
the most observable inputs be used when available. Observable inputs are inputs that market participants would use in pricing
the asset or liability developed based on market data obtained from independent sources. Unobservable inputs are inputs that
reflect a company’s judgment concerning the assumptions that market participants would use in pricing the asset or liability
developed based on the best information available under the circumstances. The fair value hierarchy is broken down into
three levels based on the reliability of inputs as follows:
• Level1—Valuations based on quoted prices in active markets for identical instruments that the Company is able to
access. Since valuations are based on quoted prices that are readily and regularly available in an active market, valuation
of these products does not entail a significant degree of judgment.
• Level2—Valuations based on quoted prices in active markets for instruments that are similar, or quoted prices in markets
that are not active for identical or similar instruments, and model-derived valuations in which all significant inputs and
significant value drivers are observable in active markets.
• Level3—Valuations based on inputs that are unobservable and significant to the overall fair value measurement.
As of March 2, 2013, the Company’s financial assets utilizing Level 1 inputs include long term investment securities traded on
active securities exchanges. The Company did not have any financial assets utilizing Level 2 inputs. Financial assets utilizing
Level 3 inputs included long term investments in auction rate securities consisting of preferred shares of closed end municipal
bond funds (See ‘‘Investment Securities,’’ Note 6).
To the extent that valuation is based on models or inputs that are less observable or unobservable in the market, the
determination of fair value requires more judgment. Accordingly, the Company’s degree of judgment exercised in determining
fair value is greatest for instruments categorized in Level 3. In certain cases, the inputs used to measure fair value may fall into
different levels of the fair value hierarchy. In such cases, an asset or liability must be classified in its entirety based on the
lowest level of input that is significant to the measurement of fair value.
Valuation techniques used by the Company must be consistent with at least one of the three possible approaches: the market
approach, income approach and/or cost approach. The Company’s Level 1 valuations are based on the market approach and
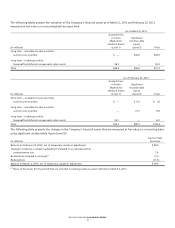
consist primarily of quoted prices for identical items on active securities exchanges. The Company’s Level 3 valuations of
auction rate securities, which had temporary valuation adjustments of approximately $2.0 million and $3.7 million as of
March 2, 2013 and February 25, 2012, respectively, are based on the income approach, specifically, discounted cash flow
analyses which utilize significant inputs based on the Company’s estimates and assumptions. As of March 2, 2013, the inputs
used in the Company’s discounted cash flow analysis included current coupon rates of 0.18%, an estimated redemption period
of 5 years and a discount rate of 0.99%. The discount rate was based on market rates for risk-free tax-exempt securities, as
adjusted for a risk premium to reflect the lack of liquidity of these investments. Assuming a higher discount rate, a longer
estimated redemption period and lower coupon rates would result in a lower fair market value. Conversely, assuming a lower
discount rate, a shorter estimated redemption period and higher coupon rates would result in a higher fair market value.
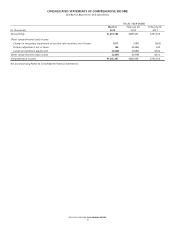
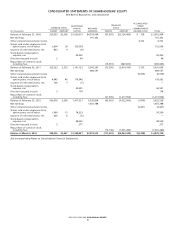
NOTES TO CONSOLIDATED FINANCIAL STATEMENTS
(continued)
BED BATH & BEYOND 2012 ANNUAL REPORT
26