Bed, Bath and Beyond 2012 Annual Report Download - page 20
Download and view the complete annual report
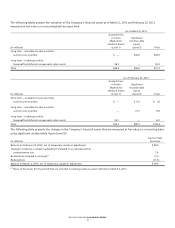
Please find page 20 of the 2012 Bed, Bath and Beyond annual report below. You can navigate through the pages in the report by either clicking on the pages listed below, or by using the keyword search tool below to find specific information within the annual report.-
 1
1 -
2
-
3
-
4
-
5
-
6
-
7
-
8
-
9
-
 10
10 -
 11
11 -
 12
12 -
 13
13 -
 14
14 -
 15
15 -
 16
16 -
 17
17 -
 18
18 -
 19
19 -
 20
20 -
 21
21 -
 22
22 -
 23
23 -
 24
24 -
 25
25 -
 26
26 -
 27
27 -
 28
28 -
 29
29 -
 30
30 -
31
-
32
-
33
-
34
-
35
-
36
-
37
-
38
-
39
-
40
-
41
-
42
-
43
-
44
-
45
-
46
-
47
-
48
-
49
-
50
-
51
-
52
-
53
-
54
-
55
-
56
-
57
-
58
-
59
-
60
-
61
-
62
-
63
-
64
-
65
-
66
-
67
-
68
-
69
-
70
-
71
-
72
-
73
-
74
-
75
-
76
 |
 |

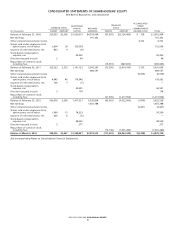
COMMON STOCK ADDITIONAL
PAID-IN
CAPITAL
RETAINED
EARNINGS
TREASURY
STOCK
ACCUMULATED
OTHER
COMPREHENSIVE
INCOME (LOSS) TOTAL(in thousands) SHARES AMOUNT SHARES AMOUNT
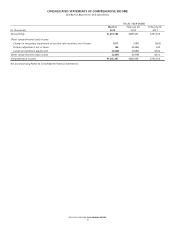
Balance at February 27, 2010 320,553 $3,206 $1,020,515 $4,754,954 (57,655) $(2,126,499) $ 728 $ 3,652,904
Net earnings 791,333 791,333
Other comprehensive (loss) income 4,372 4,372
Shares sold under employee stock
option plans, net of taxes 3,804 38 125,058 125,096
Issuance of restricted shares, net 863 9 (9) —
Stock-based compensation
expense, net 45,465 45,465
Director fees paid in stock 2 94 94
Repurchase of common stock,
including fees (15,901) (687,605) (687,605)
Balance at February 26, 2011 325,222 3,253 1,191,123 5,546,287 (73,556) (2,814,104) 5,100 3,931,659
Net earnings 989,537 989,537
Other comprehensive (loss) income (6,979) (6,979)
Shares sold under employee stock
option plans, net of taxes 4,645 46 179,546 179,592
Issuance of restricted shares, net 706 7 (7) —
Stock-based compensation
expense, net 46,501 46,501
Director fees paid in stock 3 174 174
Repurchase of common stock,
including fees (21,505) (1,217,956) (1,217,956)
Balance at February 25, 2012 330,576 3,306 1,417,337 6,535,824 (95,061) (4,032,060) (1,879) 3,922,528
Net earnings 1,037,788 1,037,788
Other comprehensive (loss) income (2,441) (2,441)
Shares sold under employee stock
option plans, net of taxes 1,489 15 74,323 74,338
Issuance of restricted shares, net 626 6 (6) —
Stock-based compensation
expense, net 48,520 48,520
Director fees paid in stock 5 277 277
Repurchase of common stock,
including fees (16,146) (1,001,280) (1,001,280)
Balance at March 2, 2013 332,696 $3,327 $1,540,451 $7,573,612 (111,207) $(5,033,340) $(4,320) $ 4,079,730
See accompanying Notes to Consolidated Financial Statements.
CONSOLIDATED STATEMENTS OF SHAREHOLDERS’ EQUITY
Bed Bath & Beyond Inc. and Subsidiaries
BED BATH & BEYOND 2012 ANNUAL REPORT
18