Bed, Bath and Beyond 2012 Annual Report Download - page 37
Download and view the complete annual report
Please find page 37 of the 2012 Bed, Bath and Beyond annual report below. You can navigate through the pages in the report by either clicking on the pages listed below, or by using the keyword search tool below to find specific information within the annual report.-
 1
1 -
2
-
3
-
4
-
5
-
6
-
7
-
8
-
9
-
10
-
11
-
12
-
13
-
14
-
15
-
16
-
17
-
18
-
19
-
20
-
21
-
22
-
23
-
24
-
25
-
26
-
 27
27 -
 28
28 -
 29
29 -
 30
30 -
 31
31 -
 32
32 -
 33
33 -
 34
34 -
 35
35 -
 36
36 -
 37
37 -
 38
38 -
 39
39 -
 40
40 -
 41
41 -
 42
42 -
 43
43 -
 44
44 -
 45
45 -
 46
46 -
 47
47 -
48
-
49
-
50
-
51
-
52
-
53
-
54
-
55
-
56
-
57
-
58
-
59
-
60
-
61
-
62
-
63
-
64
-
65
-
66
-
67
-
68
-
69
-
70
-
71
-
72
-
73
-
74
-
75
-
76
 |
 |

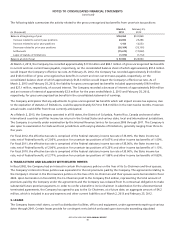
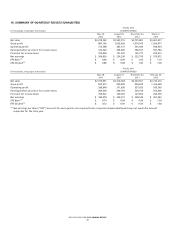
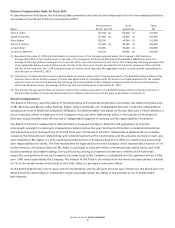
14. SUMMARY OF QUARTERLY RESULTS (UNAUDITED)
(in thousands, except per share data)
FISCAL 2012
QUARTER ENDED
May 26,
2012
August 25,
2012
November 24,
2012
March 2,
2013
Net sales $2,218,292 $2,593,015 $2,701,801 $3,401,477
Gross profit 887,199 1,032,669 1,074,010 1,394,877
Operating profit 313,398 365,137 361,649 598,034
Earnings before provision for income taxes 312,342 365,406 358,527 597,784
Provision for income taxes 105,506 141,076 125,777 223,912
Net earnings $ 206,836 $ 224,330 $ 232,750 $ 373,872
EPS-Basic
(1)
$ 0.90 $ 0.99 $ 1.04 $ 1.70
EPS-Diluted
(1)
$ 0.89 $ 0.98 $ 1.03 $ 1.68
(in thousands, except per share data)
FISCAL 2011
QUARTER ENDED
May 28,
2011
August 27,
2011
November 26,
2011
February 25,
2012
Net sales $2,109,951 $2,314,064 $2,343,561 $2,732,314
Gross profit 857,572 950,999 958,693 1,163,669
Operating profit 288,948 371,636 357,020 550,765
Earnings before provision for income taxes 289,500 369,764 356,418 553,806
Provision for income taxes 108,922 140,392 127,874 202,763
Net earnings $ 180,578 $ 229,372 $ 228,544 $ 351,043
EPS-Basic
(1)
$ 0.74 $ 0.94 $ 0.96 $ 1.50
EPS-Diluted
(1)
$ 0.72 $ 0.93 $ 0.95 $ 1.48
(1)
Net earnings per share (‘‘EPS’’) amounts for each quarter are required to be computed independently and may not equal the amount
computed for the total year.
BED BATH & BEYOND 2012 ANNUAL REPORT
35