Bed, Bath and Beyond 2012 Annual Report Download - page 8
Download and view the complete annual report
Please find page 8 of the 2012 Bed, Bath and Beyond annual report below. You can navigate through the pages in the report by either clicking on the pages listed below, or by using the keyword search tool below to find specific information within the annual report.-
 1
1 -
 2
2 -
 3
3 -
 4
4 -
 5
5 -
 6
6 -
 7
7 -
 8
8 -
 9
9 -
 10
10 -
 11
11 -
 12
12 -
 13
13 -
 14
14 -
 15
15 -
 16
16 -
 17
17 -
 18
18 -
 19
19 -
20
-
21
-
22
-
23
-
24
-
25
-
26
-
27
-
28
-
29
-
30
-
31
-
32
-
33
-
34
-
35
-
36
-
37
-
38
-
39
-
40
-
41
-
42
-
43
-
44
-
45
-
46
-
47
-
48
-
49
-
50
-
51
-
52
-
53
-
54
-
55
-
56
-
57
-
58
-
59
-
60
-
61
-
62
-
63
-
64
-
65
-
66
-
67
-
68
-
69
-
70
-
71
-
72
-
73
-
74
-
75
-
76
 |
 |

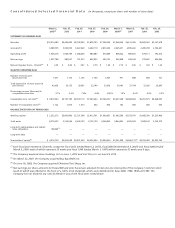
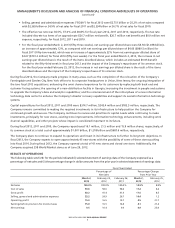
• Selling, general and administrative expenses (‘‘SG&A’’) for fiscal 2012 were $2.751 billion or 25.2% of net sales compared
with $2.363 billion or 24.9% of net sales for fiscal 2011 and $2.334 billion or 26.7% of net sales for fiscal 2010.
• The effective tax rate was 36.5%, 37.0% and 38.8% for fiscal years 2012, 2011 and 2010, respectively. The tax rate
included discrete tax items of an approximate $26.7 million net benefit, $20.7 million net benefit and $0.9 million net
expense, respectively, for fiscal 2012, 2011 and 2010.
• For the fiscal year ended March 2, 2013 (fifty-three weeks), net earnings per diluted share were $4.56 ($1.038 billion),
an increase of approximately 12%, as compared with net earnings per diluted share of $4.06 ($989.5 million) for
fiscal 2011 (fifty-two weeks), which was an increase of approximately 32% from net earnings per diluted share of
$3.07 ($791.3 million) for fiscal 2010 (fifty-two weeks). For the fiscal year ended March 2, 2013, the increase in net
earnings per diluted share is the result of the items described above, which includes an estimated $0.05 benefit
related to the fifty-third week in fiscal year 2012 and the impact of the Company’s repurchases of its common stock.
For the fiscal year ended February 25, 2012, the increase in net earnings per diluted share is the result of the items
described above and the impact of the Company’s repurchases of its common stock.
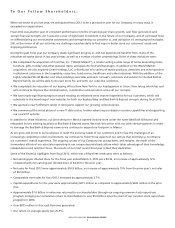
During fiscal 2012, the Company made progress in many areas, such as: the completion of the relocation of the Company’s
Farmingdale and Garden City, New York offices to its corporate headquarters in Union, New Jersey; the ongoing integration of
the two fiscal 2012 acquisitions; enhancing the omni channel experience for its customers by replacing both back end and
customer facing systems; the opening of a new distribution facility in Georgia; increasing the investment in people and systems
to upgrade the Company’s data and analytics capabilities; and the commencement of the initial phase of a new information
technology data center to enhance the Company’s disaster recovery capabilities and support its overall information technology
systems.
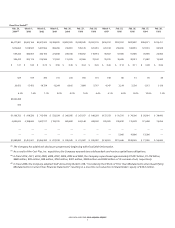
Capital expenditures for fiscal 2012, 2011 and 2010 were $314.7 million, $243.4 million and $183.5 million, respectively. The
Company remains committed to making the required investments in its infrastructure to help position the Company for
continued growth and success. The Company continues to review and prioritize its capital needs while continuing to make
investments, principally for new stores, existing store improvements, information technology enhancements, including omni
channel capabilities, and other projects whose impact is considered important to its future.
During fiscal 2012, 2011 and 2010, the Company repurchased 16.1 million, 21.5 million and 15.9 million shares, respectively, of
its common stock at a total cost of approximately $1.001 billion, $1.218 billion and $687.6 million, respectively.
The Company plans to continue to expand its operations and invest in its infrastructure to further its long term objectives. In
fiscal 2013, the Company expects to open approximately 45 new stores with the possibility of some of these stores pushing
into fiscal 2014. During fiscal 2012, the Company opened a total of 41 new stores and closed one store. Additionally, the
Company acquired 258 World Market stores as of June 29, 2012.
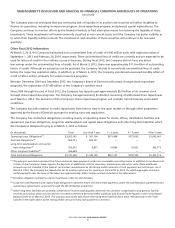
RESULTS OF OPERATIONS
The following table sets forth for the periods indicated (i) selected statement of earnings data of the Company expressed as a
percentage of net sales and (ii) the percentage change in dollar amounts from the prior year in selected statement of earnings data:
Fiscal Year Ended
Percentage of
Net Sales
Percentage Change
from Prior Year
March 2,
2013
February 25,
2012
February 26,
2011
March 2,
2013
February 25,
2012
Net sales 100.0% 100.0% 100.0% 14.9% 8.5%
Cost of sales 59.8 58.6 58.6 17.2 8.4
Gross profit 40.2 41.4 41.4 11.6 8.5
Selling, general and administrative expenses 25.2 24.9 26.7 16.4 1.2
Operating profit 15.0 16.5 14.7 4.5 21.7
Earnings before provision for income taxes 15.0 16.5 14.8 4.1 21.4
Net earnings 9.5 10.4 9.0 4.9 25.0
MANAGEMENT’S DISCUSSION AND ANALYSIS OF FINANCIAL CONDITION AND RESULTS OF OPERATIONS
(continued)
BED BATH & BEYOND 2012 ANNUAL REPORT
6