Bed, Bath and Beyond 2012 Annual Report Download - page 19
Download and view the complete annual report
Please find page 19 of the 2012 Bed, Bath and Beyond annual report below. You can navigate through the pages in the report by either clicking on the pages listed below, or by using the keyword search tool below to find specific information within the annual report.-
 1
1 -
2
-
3
-
4
-
5
-
6
-
7
-
8
-
 9
9 -
 10
10 -
 11
11 -
 12
12 -
 13
13 -
 14
14 -
 15
15 -
 16
16 -
 17
17 -
 18
18 -
 19
19 -
 20
20 -
 21
21 -
 22
22 -
 23
23 -
 24
24 -
 25
25 -
 26
26 -
 27
27 -
 28
28 -
 29
29 -
30
-
31
-
32
-
33
-
34
-
35
-
36
-
37
-
38
-
39
-
40
-
41
-
42
-
43
-
44
-
45
-
46
-
47
-
48
-
49
-
50
-
51
-
52
-
53
-
54
-
55
-
56
-
57
-
58
-
59
-
60
-
61
-
62
-
63
-
64
-
65
-
66
-
67
-
68
-
69
-
70
-
71
-
72
-
73
-
74
-
75
-
76
 |
 |

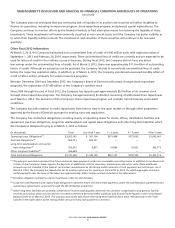
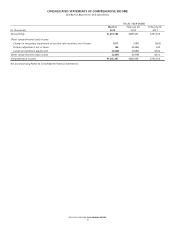
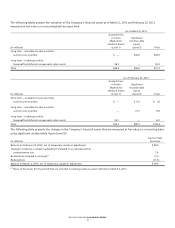
FISCAL YEAR ENDED
(in thousands)
March 2,
2013
February 25,
2012
February 26,
2011
Net earnings $1,037,788 $989,537 $791,333
Other comprehensive (loss) income:
Change in temporary impairment of auction rate securities, net of taxes 1,017 (297) (663)
Pension adjustment, net of taxes 146 (4,596) 343
Currency translation adjustment (3,604) (2,086) 4,692
Other comprehensive (loss) income (2,441) (6,979) 4,372
Comprehensive income $1,035,347 $982,558 $795,705
See accompanying Notes to Consolidated Financial Statements.
CONSOLIDATED STATEMENTS OF COMPREHENSIVE INCOME
Bed Bath & Beyond Inc. and Subsidiaries
BED BATH & BEYOND 2012 ANNUAL REPORT
17