Bed, Bath and Beyond 2012 Annual Report Download - page 59
Download and view the complete annual report
Please find page 59 of the 2012 Bed, Bath and Beyond annual report below. You can navigate through the pages in the report by either clicking on the pages listed below, or by using the keyword search tool below to find specific information within the annual report.-
 1
1 -
2
-
3
-
4
-
5
-
6
-
7
-
8
-
9
-
10
-
11
-
12
-
13
-
14
-
15
-
16
-
17
-
18
-
19
-
20
-
21
-
22
-
23
-
24
-
25
-
26
-
27
-
28
-
29
-
30
-
31
-
32
-
33
-
34
-
35
-
36
-
37
-
38
-
39
-
40
-
41
-
42
-
43
-
44
-
45
-
46
-
47
-
48
-
 49
49 -
 50
50 -
 51
51 -
 52
52 -
 53
53 -
 54
54 -
 55
55 -
 56
56 -
 57
57 -
 58
58 -
 59
59 -
 60
60 -
 61
61 -
 62
62 -
 63
63 -
 64
64 -
 65
65 -
 66
66 -
 67
67 -
 68
68 -
 69
69 -
70
-
71
-
72
-
73
-
74
-
75
-
76
 |
 |

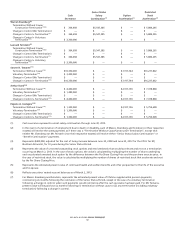
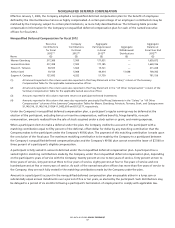
SUMMARY COMPENSATION TABLE FOR FISCAL 2012, FISCAL 2011 AND FISCAL 2010
The following table sets forth information concerning the compensation of the Company’s named executive officers.
Name and
Principal Position
Fiscal
Year
Salary
(1)(2)
($)
Stock
Awards
(3)(4)
($)
Option
Awards
(3)
($)
Change in
Pension Value
and
Nonqualified
Deferred
Compensation
Earnings
($)
All Other
Compensation
($)
Total
($)
Warren Eisenberg
(5) (6)
2012 1,142,308 1,500,033 499,991 — 136,688 3,279,020
Co-Chairman 2011 1,100,000 1,500,027 500,000 — 115,564 3,215,591
2010 1,100,000 1,500,007 500,008 — 80,072 3,180,087
Leonard Feinstein
(7) (8)
2012 1,142,308 1,500,033 499,991 — 145,025 3,287,357
Co-Chairman 2011 1,100,000 1,500,027 500,000 — 123,264 3,223,291
2010 1,100,000 1,500,007 500,008 — 146,326 3,246,341
Steven H. Temares
(9) (10) (11)
2012 3,478,846 5,999,994 5,749,992 684,106 22,211 15,935,149
Chief Executive Officer 2011 2,894,231 5,225,036 5,000,003 790,392 17,572 13,927,234
2010 2,288,462 4,500,022 4,500,007 4,179,870 15,052 15,483,413
Arthur Stark
(12) (13)
2012 1,513,847 1,350,016 600,003 — 12,262 3,476,128
President and Chief 2011 1,353,558 1,250,004 600,000 — 9,729 3,213,291
Merchandising Officer 2010 1,212,692 1,250,006 547,322 — 196,713 3,206,733
Eugene A. Castagna
(14) (15)
2012 1,326,923 1,100,010 600,003 — 13,782 3,040,718
Chief Financial Officer 2011 1,166,154 1,000,037 600,000 — 15,395 2,781,586
and Treasurer 2010 997,692 1,000,005 547,322 — 18,355 2,563,374
(1) Due to fiscal 2012 being a 53 week year and the timing of the pay cycles, the fiscal 2012 salary amounts include an additional pay
period. Without this additional pay period, fiscal 2012 salaries would have been $1,100,000 each for Messrs. Eisenberg and
Feinstein as their salaries were for the prior six fiscal years and $3,346,154, $1,456,924 and $1,276,923 for Messrs. Temares, Stark
and Castagna, respectively.
(2) Except as otherwise described in this Summary Compensation Table, salaries to named executive officers were paid in cash in fiscal
2012, fiscal 2011 and fiscal 2010, and increases in salary, if any, were effective in May of the fiscal year.
(3) The value of stock awards and option awards represents their respective total fair value on the date of grant calculated in
accordance with Accounting Standards Codification Topic No. 718, ‘‘Compensation — Stock Compensation’’ (‘‘ASC 718’’), without
regard to the estimated forfeiture related to service-based vesting conditions. All assumptions made in the valuations are
contained and described in footnote 13 to the Company’s financial statements in the Company’s Form 10-K for fiscal 2012. Stock
awards and option awards are rounded up to the nearest whole share when converted from dollars to shares. The amounts shown
in the table reflect the Company’s accounting expense and do not necessarily reflect the actual value, if any, that may be realized
by the named executive officers.
(4) The vesting of restricted stock awards depends on (i) the Company’s achievement of a performance-based test for the fiscal year of
the grant, and (ii) assuming the performance-based test is met, time vesting, subject in general to the executive remaining in the
Company’s employ on specific vesting dates. The performance-based tests for fiscal years 2012, 2011 and 2010 were met. The fair
value of the performance-based stock awards are reported above at 100% of target, their maximum value assuming the highest
level of performance.
(5) Salary for Mr. Eisenberg includes a deferral of $317,308, $275,000 and $275,000 for fiscal 2012, 2011 and 2010, respectively,
pursuant to the terms of the Company’s Nonqualified Deferred Compensation Plan. Such amount for fiscal 2012 is also reported in
the Nonqualified Deferred Compensation Table below.
(6) All Other Compensation for Mr. Eisenberg includes incremental costs to the Company for tax preparation services of $29,825,
$25,063 and $23,822, car service of $74,906, $59,740 and $28,140 and car allowance of $24,457, $23,411 and $20,760, and an
employer nonqualified deferred compensation plan matching contribution of $7,500, $7,350 and $7,350, for fiscal 2012, 2011 and
2010, respectively.
(7) Salary for Mr. Feinstein includes a deferral of $317,308, $275,000 and $275,000 for fiscal 2012, 2011 and 2010, respectively, pursuant
to the terms of the Company’s Nonqualified Deferred Compensation Plan. Such amount for fiscal 2012 is also reported in the
Nonqualified Deferred Compensation Table below.
BED BATH & BEYOND PROXY STATEMENT
57