Bed, Bath and Beyond 2006 Annual Report Download - page 7
Download and view the complete annual report
Please find page 7 of the 2006 Bed, Bath and Beyond annual report below. You can navigate through the pages in the report by either clicking on the pages listed below, or by using the keyword search tool below to find specific information within the annual report.-
 1
1 -
 2
2 -
 3
3 -
 4
4 -
 5
5 -
 6
6 -
 7
7 -
 8
8 -
 9
9 -
 10
10 -
 11
11 -
 12
12 -
 13
13 -
 14
14 -
 15
15 -
 16
16 -
 17
17 -
 18
18 -
19
-
20
-
21
-
22
-
23
-
24
-
25
-
26
-
27
-
28
-
29
-
30
-
31
-
32
-
33
-
34
-
35
-
36
-
37
 |
 |

BED BATH& BEYOND ANNUAL REPORT 2006
5
Selling, General and Administrative expenses
Selling, general and administrative expenses (“SG&A”) were $1.946 billion or 29.4% of net sales in fiscal 2006 compared to $1.607
billion or 27.7% of net sales in fiscal 2005. The increase in SG&A as a percentage of net sales is primarily due to a non-recurring
charge relating to the Company’s remediation program intended to protect its employees from certain potential adverse tax
consequences arising pursuant to Internal Revenue Code Section 409A, the expensing of stock options for twelve months in
fiscal 2006 versus six months in fiscal 2005, additional stock-based compensation charges primarily related to the revised measure-
ment dates, increased legal and accounting charges associated with the stock option review (see “Review of Equity Grants and
Procedures and Related Matters”) and an increase in advertising, which includes higher paper costs and postal rates. Lastly, there
were one-time benefits experienced in fiscal 2005, such as settlement of credit card litigation and certain insurance recoveries,
which the Company did not have in fiscal 2006.
SG&A as a percentage of net sales increased to 27.7% in fiscal 2005 from 27.1% in fiscal 2004, primarily due to the expensing
of stock options and related changes in the compensation program reflecting the early adoption of Statement of Financial
Accounting Standards (“SFAS”) No. 123 (revised 2004), “Share-Based Payment” (“SFAS No. 123R”). SG&A in fiscal 2005 was
$1.607 billion as compared to $1.394 billion in fiscal 2004.
Interest Income
Interest income in fiscal 2006, 2005 and 2004 was $43.5 million, $35.9 million and $18.8 million, respectively. Interest income
increased primarily due to increases in the Company’s average investment interest rates as a result of the upward trend in short
term interest rates.
Income Taxes
The effective tax rate was 36.30% for fiscal 2006, 37.40% for fiscal 2005 and 37.75% for fiscal 2004. The decreases are primarily
due to a reduction in the weighted average effective tax rate resulting from a change in the mix of the business within the
taxable jurisdictions in which the Company operates. For fiscal 2007, the effective tax rate is estimated at approximately 36.30%.
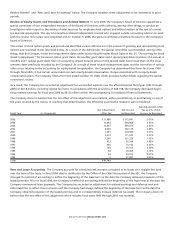
EXPANSION PROGRAM
The Company is engaged in an ongoing expansion program involving the opening of new stores in both new and existing mar-
kets, the expansion or relocation of existing stores and the continuous review of strategic acquisitions. The Company also contin-
ues to actively explore international expansion (including Canada). In the fifteen year period from the beginning of fiscal 1992 to
the end of fiscal 2006, the chain has grown from 34 to 888 stores. Total square footage grew from 917,000 square feet at the
beginning of fiscal 1992 to 27.8 million square feet at the end of fiscal 2006.
The Company intends to continue its expansion program and currently plans to open primarily new BBB stores in fiscal 2007. The
Company also plans to continue to improve and grow its CTS, Harmon and buybuy BABY concepts in fiscal 2007 (see details under
“Liquidity and Capital Resources” below). The continued growth of the Company is dependent, in large part, upon the Company’s
ability to execute its expansion program successfully.
LIQUIDITY AND CAPITAL RESOURCES
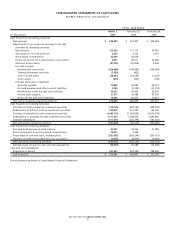
The Company has been able to finance its operations, including its expansion program, through internally generated funds. Net
cash provided by operating activities in fiscal 2006 was $613.6 million, compared with $660.4 million in fiscal 2005. The decrease in
net cash provided by operating activities was principally driven by working capital changes due to the increase in merchandise
inventories (primarily as a result of new store space) and an increase in other current assets (due to the timing of prepayments),
partially offset by an increase in net earnings and an increase in accrued expenses and other current liabilities (primarily due to
the timing of payments).
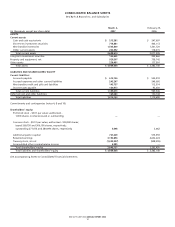
Inventory per square foot was $54.18 as of March 3, 2007 and $51.04 as of February 25, 2006. The Company continues to focus
on optimizing inventory productivity while maintaining appropriate in-store merchandise levels to support sales growth.
Net cash used in investing activities in fiscal 2006 was $397.7 million, compared with $67.6 million in fiscal 2005. The increase in
net cash used in investing activities was attributable to a decrease in redemptions of investment securities and an increase in
capital expenditures partially offset by a decrease in purchases of investment securities.
Net cash used in financing activities in fiscal 2006 was $250.3 million, compared with $567.3 million in fiscal 2005. The decrease in
net cash used in financing activities was primarily attributable to common stock repurchased of $301 million in the current year
compared to $598 million in the prior year under the Company’s stock repurchase program.