Bed, Bath and Beyond 2006 Annual Report Download - page 16
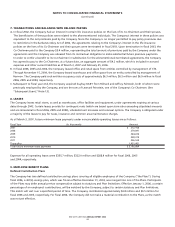
Download and view the complete annual report
Please find page 16 of the 2006 Bed, Bath and Beyond annual report below. You can navigate through the pages in the report by either clicking on the pages listed below, or by using the keyword search tool below to find specific information within the annual report.-
 1
1 -
2
-
3
-
4
-
5
-
 6
6 -
 7
7 -
 8
8 -
 9
9 -
 10
10 -
 11
11 -
 12
12 -
 13
13 -
 14
14 -
 15
15 -
 16
16 -
 17
17 -
 18
18 -
 19
19 -
 20
20 -
 21
21 -
 22
22 -
 23
23 -
 24
24 -
 25
25 -
 26
26 -
27
-
28
-
29
-
30
-
31
-
32
-
33
-
34
-
35
-
36
-
37
 |
 |

BED BATH& BEYOND ANNUAL REPORT 2006
14
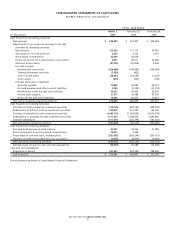
FISCAL YEAR ENDED
March 3, February 25, February 26,
(in thousands) 2007 2006 2005
Cash Flows from Operating Activities:
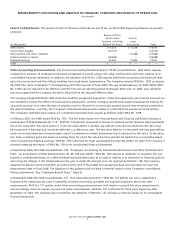
Net earnings $ 594,244)$ 572,847)$ 504,964)
Adjustments to reconcile net earnings to net cash
provided by operating activities:
Depreciation 132,955)111,111)97,491)
Amortization of bond premium 3,532)3,172)1,657)
Stock-based compensation 52,596)26,439)—)
Excess tax benefit from stock-based compensation 6,691)20,011)27,049)
Deferred income taxes (87,225) (25,874) 4,056)
Increase in assets:
Merchandise inventories (204,080) (149,692) (139,694)
Trading investment securities (2,958) (423) —)
Other current assets (38,241) (23,543) (7,350)
Other assets (695) (307) (145)
Increase (decrease) in liabilities:
Accounts payable 75,883)64,892)42,517)
Accrued expenses and other current liabilities 9,784)(5,742) (12,733)
Merchandise credit and gift card liabilities 30,223)26,453)23,873)
Income taxes payable 21,575)10,666)47,519)
Deferred rent and other liabilities 19,348)30,425)17,827)
Net cash provided by operating activities 613,632)660,435)607,031)
Cash Flows from Investing Activities:
Purchase of held-to-maturity investment securities (124,125) (442,356) (484,793)
Redemption of held-to-maturity investment securities 309,818)331,565)122,349)
Purchase of available-for-sale investment securities (1,443,115) (1,524,835) (2,414,778)
Redemption of available-for-sale investment securities 1,177,250)1,788,450)2,604,900)
Capital expenditures (317,501) (220,394) (181,363)
Net cash used in investing activities (397,673) (67,570) (353,685)
Cash Flows from Financing Activities:
Proceeds from exercise of stock options 43,393)34,953)31,080)
Excess tax benefit from stock-based compensation 14,001)2,682)—)
Repurchase of common stock, including fees (301,002) (598,244) (350,151)
Payment of deferred purchase price for acquisition (6,667) (6,667) (6,667)
Net cash used in financing activities (250,275) (567,276) (325,738)
Net (decrease) increase in cash and cash equivalents (34,316) 25,589)(72,392)
Cash and cash equivalents:
Beginning of period 247,697)222,108)294,500)
End of period $ 213,381)$ 247,697)$ 222,108)
See accompanying Notes to Consolidated Financial Statements.
CONSOLIDATED STATEMENTS OF CASH FLOWS
Bed Bath & Beyond Inc. and Subsidiaries