Bed, Bath and Beyond 2006 Annual Report Download - page 6
Download and view the complete annual report
Please find page 6 of the 2006 Bed, Bath and Beyond annual report below. You can navigate through the pages in the report by either clicking on the pages listed below, or by using the keyword search tool below to find specific information within the annual report.-
 1
1 -
 2
2 -
 3
3 -
 4
4 -
 5
5 -
 6
6 -
 7
7 -
 8
8 -
 9
9 -
 10
10 -
 11
11 -
 12
12 -
 13
13 -
 14
14 -
 15
15 -
 16
16 -
 17
17 -
18
-
19
-
20
-
21
-
22
-
23
-
24
-
25
-
26
-
27
-
28
-
29
-
30
-
31
-
32
-
33
-
34
-
35
-
36
-
37
 |
 |

BED BATH& BEYOND ANNUAL REPORT 2006
4
The Company plans to continue to expand its operations and invest in its infrastructure to reach its long-term objectives.
The Company’s fiscal 2007 store opening program is expected to focus primarily on new BBB stores. The Company also plans
to improve and grow its CTS, Harmon and buybuy BABY concepts.
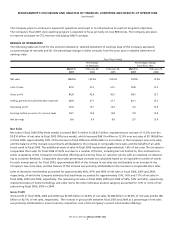
RESULTS OF OPERATIONS
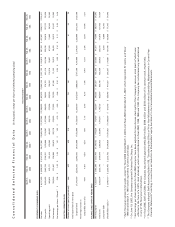
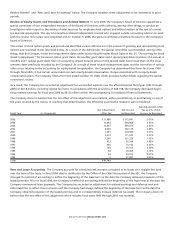
The following table sets forth for the periods indicated (i) selected statement of earnings data of the Company expressed
as a percentage of net sales and (ii) the percentage change in dollar amounts from the prior year in selected statement of
earnings data:
Fiscal Year Ended
Percentage Percentage Change
of Net Sales from Prior Year
March 3, February 25, February 26, March 3, February 25,
2007 2006 2005 2007 2006
Net sales 100.0% 100.0% 100.0% 13.9% 12.9%
Cost of sales 57.2 57.2 57.5 13.8 12.2
Gross profit 42.8 42.8 42.5 14.1 13.7
Selling, general and administrative expenses 29.4 27.7 27.1 21.1 15.3
Operating profit 13.4 15.1 15.4 1.2 10.9
Earnings before provision for income taxes 14.1 15.8 15.8 1.9 12.8
Net earnings 9.0 9.9 9.8 3.7 13.4
Net Sales
Net sales in fiscal 2006 (fifty-three weeks) increased $807.9 million to $6.617 billion, representing an increase of 13.9% over the
$5.810 billion of net sales in fiscal 2005 (fifty-two weeks), which increased $661.9 million or 12.9% over net sales of $5.148 billion
in fiscal 2004. Approximately 52% of the increase in fiscal 2006 was attributable to an increase in the Company’s new store sales,
and the balance of the increase was primarily attributable to the increase in comparable store sales and the benefit of an addi-
tional week in fiscal 2006. The additional week of sales in fiscal 2006 represented approximately 1.6% of net sales. The increase in
comparable store sales for fiscal 2006 of 4.9% was due to a number of factors, including but not limited to, the continued con-
sumer acceptance of the Company’s merchandise offerings and a strong focus on customer service with an emphasis on respond-
ing to customer feedback. Comparable store sales percentage increases are calculated based on an equivalent number of weeks
for each annual period. For fiscal 2005, approximately 64% of the increase in net sales was attributable to an increase in the
Company’s new store sales, and the balance of the increase was primarily attributable to the increase in comparable store sales.
Sales of domestics merchandise accounted for approximately 46%, 47% and 48% of net sales in fiscal 2006, 2005 and 2004,
respectively, of which the Company estimates that bed linens accounted for approximately 15%, 16% and 17% of net sales in
fiscal 2006, 2005 and 2004, respectively. The remaining net sales in fiscal 2006, 2005 and 2004 of 54%, 53% and 52%, respectively,
represented sales of home furnishings and other items. No other individual product category accounted for 10% or more of net
sales during fiscal 2006, 2005 or 2004.
Gross Profit
Gross profit in fiscal 2006, 2005 and 2004 was $2.835 billion or 42.8% of net sales, $2.486 billion or 42.8% of net sales and $2.186
billion or 42.5% of net sales, respectively. The increase in gross profit between fiscal 2005 and 2004 as a percentage of net sales
was primarily attributable to lower inventory acquisition costs of the Company’s current merchandise offerings.
MANAGEMENT’S DISCUSSION AND ANALYSIS OF FINANCIAL CONDITION AND RESULTS OF OPERATIONS
(continued)