Bed, Bath and Beyond 2006 Annual Report Download - page 15
Download and view the complete annual report
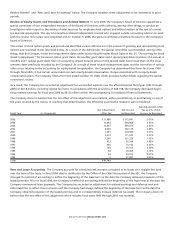
Please find page 15 of the 2006 Bed, Bath and Beyond annual report below. You can navigate through the pages in the report by either clicking on the pages listed below, or by using the keyword search tool below to find specific information within the annual report.-
 1
1 -
2
-
3
-
4
-
 5
5 -
 6
6 -
 7
7 -
 8
8 -
 9
9 -
 10
10 -
 11
11 -
 12
12 -
 13
13 -
 14
14 -
 15
15 -
 16
16 -
 17
17 -
 18
18 -
 19
19 -
 20
20 -
 21
21 -
 22
22 -
 23
23 -
 24
24 -
 25
25 -
26
-
27
-
28
-
29
-
30
-
31
-
32
-
33
-
34
-
35
-
36
-
37
 |
 |

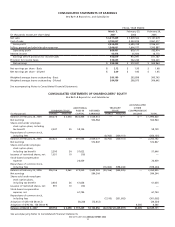
CONSOLIDATED STATEMENTS OF SHAREHOLDERS’ EQUITY
Bed Bath & Beyond Inc. and Subsidiaries
ACCUMULATED
ADDITIONAL TREASURY OTHER
COMMON STOCK PAID-IN RETAINED STOCK COMPREHENSIVE
(in thousands) SHARES AMOUNT CAPITAL EARNINGS SHARES AMOUNT INCOME TOTAL
Balance at February 28, 2004 300,278 $ 3,003 $433,404 $ 1,554,413)—$ —)$ — $ 1,990,820)
Net earnings 504,964)504,964)
Shares sold under employee
stock option plans, including
tax benefit 2,547 25 58,104 58,129)
Repurchase of common stock,
including fees (8,762) (350,151) (350,151)
Balance at February 26, 2005 302,825 3,028 491,508 2,059,377)(8,762) (350,151) — 2,203,762)
Net earnings 572,847)572,847)
Shares sold under employee
stock option plans,
including tax benefit 2,300 24 57,622 57,646)
Issuance of restricted shares, net 1,031 10 (10) —)
Stock-based compensation
expense 26,439 26,439)
Repurchase of common stock,
including fees (16,404) (598,244) (598,244)
Balance at February 25, 2006 306,156 3,062 575,559 2,632,224)(25,166) (948,395) — 2,262,450)
Net earnings 594,244)594,244)
Shares sold under employee
stock option plans,
including tax benefit 2,603 26 61,628 61,654)
Issuance of restricted shares, net 991 10 (10) )—)
Stock-based compensation
expense, net 61,744 61,744)
Repurchase of common stock,
including fees (7,510) (301,002) (301,002)
Adoption of SAB 108 (Note 2) 38,288 (72,612) (34,324)
Adoption of SFAS No. 158 (Note 9) 4,385 4,385)
Balance at March 3, 2007 309,750 $ 3,098 $ 737,209 $3,153,856)(32,676) $(1,249,397) $4,385 $2,649,151)
See accompanying Notes to Consolidated Financial Statements.
BED BATH& BEYOND ANNUAL REPORT 2006
13
FISCAL YEAR ENDED
March 3, February 25, February 26,
(in thousands, except per share data) 2007 2006 2005
Net sales $ 6,617,429 $ 5,809,562 $ 5,147,678
Cost of sales 3,782,027 3,323,814 2,961,377
Gross profit 2,835,402 2,485,748 2,186,301
Selling, general and administrative expenses 1,946,001 1,606,577 1,393,887
Operating profit 889,401 879,171 792,414
Interest income 43,478 35,920 18,773
Earnings before provision for income taxes 932,879 915,091 811,187
Provision for income taxes 338,635 342,244 306,223
Net earnings $ 594,244 $ 572,847 $ 504,964
Net earnings per share - Basic $ 2.12 $ 1.95 $ 1.68
Net earnings per share - Diluted $ 2.09 $ 1.92 $ 1.65
Weighted average shares outstanding - Basic 280,199 293,899 300,743
Weighted average shares outstanding - Diluted 284,956 298,973 306,642
See accompanying Notes to Consolidated Financial Statements.
CONSOLIDATED STATEMENTS OF EARNINGS
Bed Bath & Beyond Inc. and Subsidiaries