BMW 2001 Annual Report Download - page 39
Download and view the complete annual report
Please find page 39 of the 2001 BMW annual report below. You can navigate through the pages in the report by either clicking on the pages listed below, or by using the keyword search tool below to find specific information within the annual report.-
 1
1 -
2
-
3
-
4
-
5
-
6
-
7
-
8
-
9
-
10
-
11
-
12
-
13
-
14
-
15
-
16
-
17
-
18
-
19
-
20
-
21
-
22
-
23
-
24
-
25
-
26
-
27
-
28
-
 29
29 -
 30
30 -
 31
31 -
 32
32 -
 33
33 -
 34
34 -
 35
35 -
 36
36 -
 37
37 -
 38
38 -
 39
39 -
 40
40 -
 41
41 -
 42
42 -
 43
43 -
 44
44 -
 45
45 -
 46
46 -
 47
47 -
 48
48 -
 49
49 -
50
-
51
-
52
-
53
-
54
-
55
-
56
-
57
-
58
-
59
-
60
-
61
-
62
-
63
-
64
-
65
-
66
-
67
-
68
-
69
-
70
-
71
-
72
-
73
-
74
-
75
-
76
-
77
-
78
-
79
-
80
-
81
-
82
-
83
-
84
-
85
-
86
-
87
-
88
-
89
-
90
-
91
-
92
-
93
-
94
-
95
-
96
-
97
-
98
-
99
-
100
-
101
-
102
-
103
-
104
-
105
-
106
-
107
-
108
-
109
-
110
-
111
-
112
-
113
-
114
-
115
-
116
-
117
-
118
-
119
-
120
-
121
-
122
-
123
-
124
-
125
-
126
-
127
-
128
-
129
-
130
-
131
-
132
-
133
-
134
-
135
-
136
-
137
-
138
-
139
-
140
-
141
-
142
-
143
-
144
-
145
-
146
-
147
-
148
-
149
-
150
-
151
-
152
-
153
-
154
-
155
-
156
-
157
-
158
-
159
-
160
-
161
-
162
-
163
-
164
-
165
-
166
-
167
-
168
-
169
-
170
-
171
-
172
-
173
-
174
-
175
-
176
-
177
-
178
-
179
-
180
-
181
-
182
-
183
-
184
-
185
-
186
-
187
-
188
-
189
-
190
-
191
-
192
-
193
-
194
-
195
-
196
 |
 |
001 BMW Group in figures
004 Report of the Supervisory Board
008 Supervisory Board
011 Board of Management
012 Group Management Report
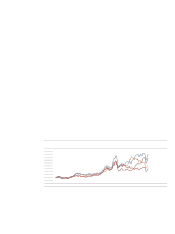
029 BMW Stock
033 Group Financial Statements
098 BMW AG Financial Statements
104 BMW Group Annual Comparison
106 BMW Group Locations
108 Glossary
112 Index
38
Debt only increased by 2.5 % to euro 25.7 billion,
as a result of the small increase in sales financing
business. Debt as a percentage of the balance
sheet total fell by 0.6 percentage points to 50.1%.
In industrial operations, debt as a percentage of the
balance sheet total is only 7.0 % (2000: 5.4%).
Trade payables and other liabilities are in line
with the previous year.
Explanatory comments on the cash flow
statement
The cash flow statement shows the sources and ap-
plication of cash flows in 2000 and 2001, classified
into cash flows from operating, investing and financ-
ing activities.
Cash and cash equivalents in the cash flow
statement are the same as those disclosed in the
balance sheet.
Operating activities in fiscal year 2001 generat-
ed a cash inflow of euro 5.9 billion (2000: euro 4.9
billion). In calculating these cash inflows, the cash
outflows relating to the Rover disengagement have
been allocated to investing activities.
The cash outflow from investing activities
amounted to euro 6.1 billion, a reduction of euro
1,3 billion compared to the previous year, excluding
sales proceeds of euro 2.0 billion. This reduced cash
outflow related mainly to sales financing business,
where net investment was down by euro 1.7 billion
following the exit from financing Rover and Land
Rover vehicles. Higher capital expenditure on intan-
gible assets and property, plant and equipment has
led to an increase of euro 538 million in the cash
outflow compared to the previous year. The cash
outflow for the Rover disengagement was euro
1,017 million. 96.9% (2000: 89.9 %) of the cash
outflow from investing activities was covered by the
cash inflow from operating activities.
The cash outflow from financing activities was
euro 258 million.
After adjustment for the effects of exchange-
rate fluctuations and changes in the composition of
the Group, the various cash flows resulted in a de-
crease in cash and cash equivalents of euro 490 mil-
lion (2000: an increase of euro 826 million).
Net interest-bearing assets (cash and cash
equivalents and marketable securities less debt) in
the industrial operations increased by euro 181 mil-
lion to euro 1.5 billion.