BMW 2001 Annual Report Download - page 37
Download and view the complete annual report
Please find page 37 of the 2001 BMW annual report below. You can navigate through the pages in the report by either clicking on the pages listed below, or by using the keyword search tool below to find specific information within the annual report.-
 1
1 -
2
-
3
-
4
-
5
-
6
-
7
-
8
-
9
-
10
-
11
-
12
-
13
-
14
-
15
-
16
-
17
-
18
-
19
-
20
-
21
-
22
-
23
-
24
-
25
-
26
-
 27
27 -
 28
28 -
 29
29 -
 30
30 -
 31
31 -
 32
32 -
 33
33 -
 34
34 -
 35
35 -
 36
36 -
 37
37 -
 38
38 -
 39
39 -
 40
40 -
 41
41 -
 42
42 -
 43
43 -
 44
44 -
 45
45 -
 46
46 -
 47
47 -
48
-
49
-
50
-
51
-
52
-
53
-
54
-
55
-
56
-
57
-
58
-
59
-
60
-
61
-
62
-
63
-
64
-
65
-
66
-
67
-
68
-
69
-
70
-
71
-
72
-
73
-
74
-
75
-
76
-
77
-
78
-
79
-
80
-
81
-
82
-
83
-
84
-
85
-
86
-
87
-
88
-
89
-
90
-
91
-
92
-
93
-
94
-
95
-
96
-
97
-
98
-
99
-
100
-
101
-
102
-
103
-
104
-
105
-
106
-
107
-
108
-
109
-
110
-
111
-
112
-
113
-
114
-
115
-
116
-
117
-
118
-
119
-
120
-
121
-
122
-
123
-
124
-
125
-
126
-
127
-
128
-
129
-
130
-
131
-
132
-
133
-
134
-
135
-
136
-
137
-
138
-
139
-
140
-
141
-
142
-
143
-
144
-
145
-
146
-
147
-
148
-
149
-
150
-
151
-
152
-
153
-
154
-
155
-
156
-
157
-
158
-
159
-
160
-
161
-
162
-
163
-
164
-
165
-
166
-
167
-
168
-
169
-
170
-
171
-
172
-
173
-
174
-
175
-
176
-
177
-
178
-
179
-
180
-
181
-
182
-
183
-
184
-
185
-
186
-
187
-
188
-
189
-
190
-
191
-
192
-
193
-
194
-
195
-
196
 |
 |
001 BMW Group in figures
004 Report of the Supervisory Board
008 Supervisory Board
011 Board of Management
012 Group Management Report
029 BMW Stock
033 Group Financial Statements
098 BMW AG Financial Statements
104 BMW Group Annual Comparison
106 BMW Group Locations
108 Glossary
112 Index
36
are primarily the software and other activities of the
BMW Group not relating to specific segments as
well as consolidations.
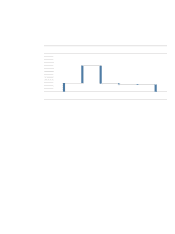
Balance sheet structure
The balance sheet total of the Group increased by
3.9% to euro 51.3 billion. The main factors behind
this increase on the assets side of the balance
sheet were the non-current assets (+ 5.6%), inven-
tories (+21.4 %) and other receivables (+19.4 %). On
the equity and liabilities side of the balance sheet,
the main increases were in equity (+ 14.2 %) and
debt (+ 2.5%). Currency fluctuations had only a mi-
nor impact on the balance sheet total.
Intangible assets increased by 13.1% to euro
2.4 billion. Within intangible assets, capitalised de-
velopment costs increased by 10.8% to euro 2.3 bil-
lion. Development costs recognised as assets
during the year amounted to euro 665 million.
Property, plant and equipment increased by
euro 760 million to euro 7.4 billion. This was mainly
due to increased capital expenditure of BMW AG
and of the Oxford and Goodwood production plants.
The reduction in financial assets is attributable
primarily to the fair value measurement of the invest-
ment in RollsRoyce plc, London.
The carrying amount of leased products in the
balance sheet was virtually unchanged compared to
the previous year (+0.4%).
Inventories increased by 21.4 % to euro 4.5 bil-
lion. This increase was attributable to the general
growth of the business and to the build-up of inven-
tory levels in conjunction with the market launches
of the MINI and BMW 7 Series. Inventories as a per-
centage of the balance sheet total thus increased by
1.3 percentage points.
Trade receivables went up by 7.9 % in line with
the growth of business.
The relatively small growth of receivables from
sales financing (+1.8 %) is caused by the exit from
financing Rover and Land Rover vehicles.
Other receivables increased by 19.4% to euro
4.2 billion. This is attributable above all to the higher
level of receivables from non-consolidated sub-
sidiaries and to the increase in the fair values of de-
rivative financial instruments.
Cash and cash equivalents and marketable se-
curities fell by 10.2 % to euro 3.3 billion. The mix of
cash and cash equivalents and marketable securities
has changed to a higher proportion of short-term
securities.
On the equity and liabilities side of the balance
sheet, Group equity increased by 14,2 % to euro 10.8
billion, mainly as result of the Group net profit of euro
1.9 billion and the issue of employee shares of euro
24 million. The payment of the dividend for 2000,
exchange rate fluctuations and the accounting treat-
ment of changes in the fair values of financial instru-
ments reduced equity by euro 552 million. The equi-
ty ratio of the Group increased by 1.9 percentage
points to 21.0 %. The equity ratio for industrial oper-
ations was 37.0% compared to 35.9% at the end of
the previous year. The equity ratio for financial oper-
ations improved by 0.3 percentage points to 8.4%.
Provisions recognised in the balance sheet
decreased by 1.4 % to euro 6.8 billion, largely as a
result of the utilisation of provisions for obligations
and risks from the sale of Rover Cars and Land
Rover. Against this, higher other provisions were re-
quired as a result of the general growth of business
and increased obligations relating to personnel.