Avon 2009 Annual Report Download - page 92
Download and view the complete annual report
Please find page 92 of the 2009 Avon annual report below. You can navigate through the pages in the report by either clicking on the pages listed below, or by using the keyword search tool below to find specific information within the annual report.-
 1
1 -
2
-
3
-
4
-
5
-
6
-
7
-
8
-
9
-
10
-
11
-
12
-
13
-
14
-
15
-
16
-
17
-
18
-
19
-
20
-
21
-
22
-
23
-
24
-
25
-
26
-
27
-
28
-
29
-
30
-
31
-
32
-
33
-
34
-
35
-
36
-
37
-
38
-
39
-
40
-
41
-
42
-
43
-
44
-
45
-
46
-
47
-
48
-
49
-
50
-
51
-
52
-
53
-
54
-
55
-
56
-
57
-
58
-
59
-
60
-
61
-
62
-
63
-
64
-
65
-
66
-
67
-
68
-
69
-
70
-
71
-
72
-
73
-
74
-
75
-
76
-
77
-
78
-
79
-
80
-
81
-
 82
82 -
 83
83 -
 84
84 -
 85
85 -
 86
86 -
 87
87 -
 88
88 -
 89
89 -
 90
90 -
 91
91 -
 92
92 -
 93
93 -
 94
94 -
 95
95 -
 96
96 -
 97
97 -
 98
98 -
 99
99 -
 100
100 -
 101
101 -
 102
102 -
103
-
104
-
105
-
106
 |
 |

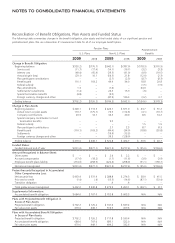
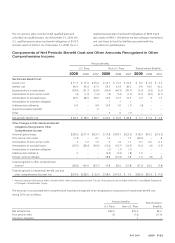
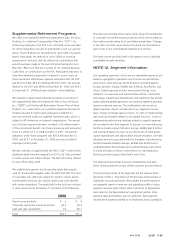
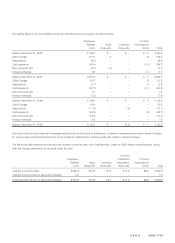
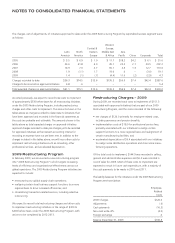
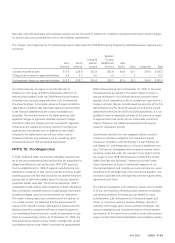
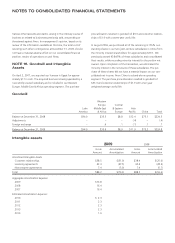
NOTES TO CONSOLIDATED FINANCIAL STATEMENTS
Summarized financial information concerning our reportable segments as of December 31 is shown in the following tables.
Total Revenue &Operating Profit
2009 2008 2007
Total
Revenue
Operating
Profit (Loss)
Total
Revenue
Operating
Profit (Loss)
Total
Revenue
Operating
Profit (Loss)
Latin America $4,103.2 $647.9 $3,884.1 $690.3 $3,298.9 $483.1
North America 2,262.7 110.4 2,492.7 213.9 2,622.1 213.1
Central &Eastern Europe 1,500.1 244.9 1,719.5 346.2 1,577.8 296.1
Western Europe, Middle East &Africa 1,277.8 84.2 1,351.7 121.0 1,308.6 33.9
Asia Pacific 885.6 74.2 891.2 102.4 850.8 64.3
China 353.4 20.1 350.9 17.7 280.5 2.0
Total from operations 10,382.8 1,181.7 10,690.1 1,491.5 9,938.7 1,092.5
Global and other –(163.5) –(152.2) –(219.8)
Total $10,382.8 $1,018.2 $10,690.1 $1,339.3 $9,938.7 $872.7
Total Assets
2009 2008 2007
Latin America $2,414.9 $1,640.7 $1,597.9
North America 831.5 899.0 789.1
Central &Eastern Europe 819.5 749.3 948.9
Western Europe, Middle
East &Africa 654.9 565.3 613.4
Asia Pacific 434.1 396.3 426.8
China 306.7 316.8 284.2
Total from operations 5,461.6 4,567.4 4,660.3
Global and other 1,371.1 1,506.6 1,055.9
Total assets $6,832.7 $6,074.0 $5,716.2
Capital Expenditures
2009 2008 2007
Latin America $160.6 $116.0 $90.1
North America 39.3 111.9 77.9
Central &Eastern Europe 29.3 42.2 29.6
Western Europe, Middle
East &Africa 33.9 41.6 31.2
Asia Pacific 8.4 24.8 16.6
China 7.9 13.2 9.7
Total from operations 279.4 349.7 255.1
Global and other 17.5 30.8 23.4
Total capital expenditures $296.9 $380.5 $278.5
Depreciation and Amortization
2009 2008 2007
Latin America $53.2 $55.5 $49.6
North America 43.2 37.6 35.0
Central &Eastern Europe 19.8 25.8 19.7
Western Europe, Middle
East &Africa 28.0 31.8 26.4
Asia Pacific 11.6 13.3 16.0
China 8.2 5.9 5.8
Total from operations 164.0 169.9 152.5
Global and other 16.7 17.3 19.6
Total depreciation and
amortization $180.7 $187.2 $172.1
Total Revenue by Major Country
2009 2008 2007
U.S. $1,864.4 $2,061.8 $2,194.9
Brazil 1,817.1 1,674.3 1,352.0
All other 6,701.3 6,954.0 6,391.8
Total $10,382.8 $10,690.1 $9,938.7
Amajor country is defined as one with total revenues greater
than 10% of consolidated total revenues.