Avon 2009 Annual Report Download - page 48
Download and view the complete annual report
Please find page 48 of the 2009 Avon annual report below. You can navigate through the pages in the report by either clicking on the pages listed below, or by using the keyword search tool below to find specific information within the annual report.-
 1
1 -
2
-
3
-
4
-
5
-
6
-
7
-
8
-
9
-
10
-
11
-
12
-
13
-
14
-
15
-
16
-
17
-
18
-
19
-
20
-
21
-
22
-
23
-
24
-
25
-
26
-
27
-
28
-
29
-
30
-
31
-
32
-
33
-
34
-
35
-
36
-
37
-
 38
38 -
 39
39 -
 40
40 -
 41
41 -
 42
42 -
 43
43 -
 44
44 -
 45
45 -
 46
46 -
 47
47 -
 48
48 -
 49
49 -
 50
50 -
 51
51 -
 52
52 -
 53
53 -
 54
54 -
 55
55 -
 56
56 -
 57
57 -
 58
58 -
59
-
60
-
61
-
62
-
63
-
64
-
65
-
66
-
67
-
68
-
69
-
70
-
71
-
72
-
73
-
74
-
75
-
76
-
77
-
78
-
79
-
80
-
81
-
82
-
83
-
84
-
85
-
86
-
87
-
88
-
89
-
90
-
91
-
92
-
93
-
94
-
95
-
96
-
97
-
98
-
99
-
100
-
101
-
102
-
103
-
104
-
105
-
106
 |
 |

PART II
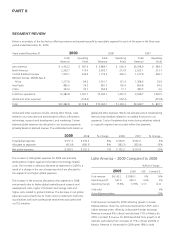
Total revenue increased for 2008, driven by alarger average
order and growth in Active Representatives, as well as favorable
foreign exchange. Growth in Active Representatives reflected
significant investments in RVP and acontinued high level of
investment in advertising. Revenue for 2008 benefited from
continued growth in substantially all markets. In particular,
during 2008, revenue grew 24% in Brazil, 36% in Venezuela,
5% in Mexico and 3% in Colombia. Revenue growth in Brazil was
driven by higher average order, growth in Active Representatives
and theimpact of foreign exchange. Revenue growth in Venezuela
was driven by higher average order, while revenue in Mexico
benefited from growth in Active Representatives. We experienced a
deceleration of growth in Colombia during the second half of
2008 due to economic conditions as well as competition.
The increase in operating margin in Latin America for 2008 was
primarily due to the impact of higher revenues, increased pricing,
lower inventory obsolescence expense, and lower costs to
implement restructuring initiatives. These benefits to margin
were partially offset by higher investments in RVP. Operating
margin for 2007 benefited from the recognition of unclaimed
sales-related tax credits.
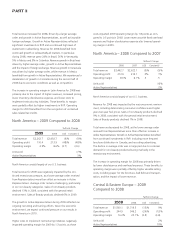
North America –2009 Compared to 2008
%/Point Change
2009 2008 US$ Constant $
Total revenue $2,262.7 $2,492.7 (9)% (9)%
Operating profit 110.4 213.9 (48)% (48)%
Operating margin 4.9% 8.6% (3.7) (3.6)
Units sold (7)%
Active Representatives 3%
North America consists largely of our U.S. business.
Total revenue for 2009 was negatively impacted by the con-
tinued recessionary pressure, as alower average order received
from Representatives more than offset an increase in Active
Representatives. Average order remains challenging, particularly
in our non-beauty categories. Sales of non-Beauty products
declined 13% in 2009, consistent with the general retail
environment. Sales of Beauty products declined 6% in 2009.
The growth in Active Representatives during 2009 reflected our
ongoing recruiting and training efforts. Given the economic
environment, we expect continued pressure on our results in
North America in 2010.
Higher costs to implement restructuring initiatives negatively
impacted operating margin for 2009 by 1.3 points, as these
costs impacted 2009 operating margin by 1.8 points as com-
pared to 0.5 points in 2008. Lower revenues with fixed overhead
expense and higher obsolescence expense also lowered operat-
ing margin in 2009.
North America –2008 Compared to 2007
%/Point Change
2008 2007 US$ Constant $
Total revenue $2,492.7 $2,622.1 (5)% (5)%
Operating profit 213.9 213.1 0% 1%
Operating margin 8.6% 8.1% .5 .5
Units sold (4)%
Active Representatives 2%
North America consists largely of our U.S. business.
Revenue for 2008 was impacted by the macroeconomic environ-
ment, including deteriorating consumer confidence and higher
year-over-year fuel prices. Sales of non-Beauty products declined
9% in 2008, consistent with the general retail environment.
Sales of Beauty products declined 1% in 2008.
Total revenue decreased for 2008, as the lower average order
received from Representatives more than offset an increase in
Active Representatives. Growth in Active Representatives benefited
from continued investments in RVP, including more frequent
brochure distribution in Canada, and recruiting advertising.
The decline in average order was in large part due to customer
demand for non-beauty products slowing markedly in the
recessionary environment.
The increase in operating margin for 2008 was primarily driven
by lower obsolescence and overhead expenses. These benefits to
operating margin were partially offset by higher variable selling
costs, including paper for the brochure, bad debt and transpor-
tation, and the impact of lower revenue.
Central &Eastern Europe –2009
Compared to 2008
%/Point Change
2009 2008 US$ Constant $
Total revenue $1,500.1 $1,719.5 (13)% 9%
Operating profit 244.9 346.2 (29)% (12)%
Operating margin 16.3% 20.1% (3.8) (3.8)
Units sold 2%
Active Representatives 10%