Avon 2009 Annual Report Download - page 49
Download and view the complete annual report
Please find page 49 of the 2009 Avon annual report below. You can navigate through the pages in the report by either clicking on the pages listed below, or by using the keyword search tool below to find specific information within the annual report.-
 1
1 -
2
-
3
-
4
-
5
-
6
-
7
-
8
-
9
-
10
-
11
-
12
-
13
-
14
-
15
-
16
-
17
-
18
-
19
-
20
-
21
-
22
-
23
-
24
-
25
-
26
-
27
-
28
-
29
-
30
-
31
-
32
-
33
-
34
-
35
-
36
-
37
-
38
-
 39
39 -
 40
40 -
 41
41 -
 42
42 -
 43
43 -
 44
44 -
 45
45 -
 46
46 -
 47
47 -
 48
48 -
 49
49 -
 50
50 -
 51
51 -
 52
52 -
 53
53 -
 54
54 -
 55
55 -
 56
56 -
 57
57 -
 58
58 -
 59
59 -
60
-
61
-
62
-
63
-
64
-
65
-
66
-
67
-
68
-
69
-
70
-
71
-
72
-
73
-
74
-
75
-
76
-
77
-
78
-
79
-
80
-
81
-
82
-
83
-
84
-
85
-
86
-
87
-
88
-
89
-
90
-
91
-
92
-
93
-
94
-
95
-
96
-
97
-
98
-
99
-
100
-
101
-
102
-
103
-
104
-
105
-
106
 |
 |

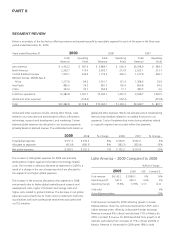
Total revenue decreased for2009, impacted by unfavorable foreign
exchange. Constant $revenue for 2009 increased despite con-
tinued recessionary pressure throughout the region, reflecting
growth in Active Representatives, driven by investments in RVP and
brochures as well as strong marketing offers. While the impact
of unfavorable foreign exchange rates drove revenue declines of
7% in Russia and 19% in Ukraine for 2009, Constant $revenue
grew 18% in Russia and 20% in Ukraine.
The Constant $revenue increase in Russia for 2009 was primarily
due to strong growth in Active Representatives. In late 2008, we
completed the roll-out of Sales Leadership and improved the
discount structure we offered Representatives in Russia. The
Constant $revenue increase in Ukraine for 2009 was primarily
due to growth in Active Representatives and ahigher average
order due to increased pricing from inflation, partially offset by
the negative impact of recent economic conditions.
The decrease in operating margin for 2009 was primarily driven
by the unfavorable impacts of foreign exchange transactions,
which negatively impacted operating margin by an estimated 5
points. Higher costs to implement restructuring initiatives neg-
atively impacted operating margin for 2009 by 1.6 points, as
these costs impacted 2009 operating margin by 1.8 points as
compared to 0.2 points in 2008. Partially offsetting these
unfavorable items were lower advertising costs in 2009 and the
benefit of higher Constant $revenues with fixed overhead expenses.
Operating margin for 2009 was also negatively impacted by
higher obsolescence expense in 2009, as the 2008 period bene-
fited from an adjustment to inventory obsolescence reserve due
to changes in our estimates to our disposition plan of products
reserved for under PLS.
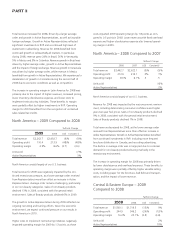
Central &Eastern Europe –2008
Compared to 2007
%/Point Change
2008 2007 US$ Constant $
Total revenue $1,719.5 $1,577.8 9% 4%
Operating profit 346.2 296.1 17% 11%
Operating margin 20.1% 18.8% 1.3 1.1
Units sold 2%
Active Representatives 12%
Beginning at the end of June 2007, we provided our Representa-
tives with additional selling opportunities through more frequent
brochure distribution, which encourages more frequent customer
contact. Active representative growth during thefirst half of 2008
benefited from the increased brochure distribution frequency.
Total revenue increased for 2008, reflecting growth in Active
Representatives, as well as favorable foreign exchange, partially
offset by alower average order. Average order was impacted by
alower average order during the first half of 2008 as our Repre-
sentatives transitioned to the shorter selling cycle. Average order
during the second half of 2008 declined to amuch lesser degree
as compared to the first half of 2008.
For 2008, the region’s revenue growth benefited from increases
in Russia of 8%, as well as growth in other markets in theregion,
led by Ukraine with growth of over 20%. The revenue increase
in Russia for 2008 was primarily due to strong growth in Active
Representatives, as well as favorable foreign exchange. We
completed the roll-out of Sales Leadership and improved the
discount structure we offer Representatives in Russia near the
end of the third quarter of 2008.
The increase in operating margin for 2008 was primarily driven
by the impact of higher revenue, lower inventory obsolescence
expense and increased pricing, partially offset by higher spend-
ing on RVP and advertising, and the impact of unfavorable
foreign exchange on product cost.
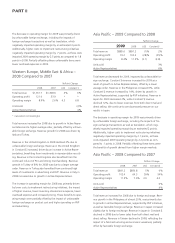
Western Europe, Middle East &Africa –
2009 Compared to 2008
%/Point Change
2009 2008 US$ Constant $
Total revenue $1,277.8 $1,351.7 (5)% 6%
Operating profit 84.2 121.0 (30)% (22)%
Operating margin 6.6% 8.9% (2.3) (2.1)
Units sold 8%
Active Representatives 10%
Total revenue decreased for 2009, impacted by unfavorable
foreign exchange. Constant $revenue increased for 2009 as a
result of growth in Active Representatives, offset by alower
average order reflecting continued recessionary pressure. Active
Representatives growth for 2009 benefited by one point due to
the acquisition of asmall distributor in Saudi Arabia during the
second quarter of 2009. This acquisition had minimal impact on
the financial results. Revenue declined 16% in the United Kingdom
during 2009, due to the negative impact of foreign exchange.
Constant $revenue in the United Kingdom declined 1% during
2009, as strong merchandising of “smart value” products coun-
tered the recessionary pressure. Revenue in Turkey increased 2%
during 2009. Turkey’s Constant $revenue increased 21% during
2009, reflecting an increase in Active Representatives, driven by
investments in RVP and Sales Leadership.
AVON2009 31