Avon 2009 Annual Report Download - page 35
Download and view the complete annual report
Please find page 35 of the 2009 Avon annual report below. You can navigate through the pages in the report by either clicking on the pages listed below, or by using the keyword search tool below to find specific information within the annual report.-
 1
1 -
2
-
3
-
4
-
5
-
6
-
7
-
8
-
9
-
10
-
11
-
12
-
13
-
14
-
15
-
16
-
17
-
18
-
19
-
20
-
21
-
22
-
23
-
24
-
 25
25 -
 26
26 -
 27
27 -
 28
28 -
 29
29 -
 30
30 -
 31
31 -
 32
32 -
 33
33 -
 34
34 -
 35
35 -
 36
36 -
 37
37 -
 38
38 -
 39
39 -
 40
40 -
 41
41 -
 42
42 -
 43
43 -
 44
44 -
 45
45 -
46
-
47
-
48
-
49
-
50
-
51
-
52
-
53
-
54
-
55
-
56
-
57
-
58
-
59
-
60
-
61
-
62
-
63
-
64
-
65
-
66
-
67
-
68
-
69
-
70
-
71
-
72
-
73
-
74
-
75
-
76
-
77
-
78
-
79
-
80
-
81
-
82
-
83
-
84
-
85
-
86
-
87
-
88
-
89
-
90
-
91
-
92
-
93
-
94
-
95
-
96
-
97
-
98
-
99
-
100
-
101
-
102
-
103
-
104
-
105
-
106
 |
 |
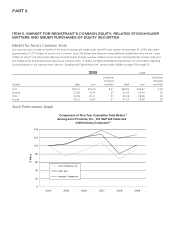
Assumed $100 invested on December 31, 2004, in Avon’s common stock, the S&P 500 Index and the Industry Composite. The dollar
amounts indicated in the graph above and in the chart below are as of December 31 or the last trading day in the year indicated.
2004 2005 2006 2007 2008 2009
Avon $100.00 $75.23 $89.11 $108.72 $67.73 $91.54
S&P 500 100.00 104.91 121.48 128.16 80.74 102.11
Industry Composite(2) 100.00 103.98 119.32 137.65 118.26 127.54
(1) Total return assumes reinvestment of dividends at the closing price at the end of each quarter.
(2) The Industry Composite includes Alberto-Culver, Clorox, Colgate–Palmolive, Estée Lauder, Kimberly Clark, Procter &Gamble and Revlon.
The Stock Performance Graph shall not be deemed to be “solicit-
ing material” or to be “filed” with the Securities and Exchange
Commission or subject to the liabilities of Section 18 under the
Securities Exchange Act of 1934. In addition, it shall not be
deemed incorporated by reference by any statement that
incorporates this annual report on Form 10-K by reference into
any filing under the Securities Act of 1933 or the Securities
Exchange Act of 1934, except to the extent that we specifically
incorporate this information by reference.
Issuer Purchases of Equity Securities
The following table provides information about our purchases of our common stock during the fourth quarter of 2009:
Total Number
of Shares
Purchased (1)
Average Price
Paid per Share
Total Number of
Shares Purchased as
Part of Publicly
Announced Programs (2)
Approximate Dollar
Value of Shares that
May Yet Be Purchased
Under the Program
10/1/09 –10/31/09 446 $36.00 –$1,819,809,000
11/1/09 –11/30/09 1,134 31.95 –1,819,809,000
12/1/09 –12/31/09 1,061 34.84 –1,819,809,000
Total 2,641 –
(1) Consists of shares that were repurchased by us in connection with employee elections to use shares to pay withholding taxes upon the vesting of their
restricted stock units.
(2) There were no shares purchased during the fourth quarter of 2009 as part of our $2.0 billion share repurchase program, publicly announced on October 11,
2007. The program commenced on December 17, 2007, and is scheduled to expire on December 17, 2012.
AVON2009 17