Avon 2009 Annual Report Download - page 46
Download and view the complete annual report
Please find page 46 of the 2009 Avon annual report below. You can navigate through the pages in the report by either clicking on the pages listed below, or by using the keyword search tool below to find specific information within the annual report.-
 1
1 -
2
-
3
-
4
-
5
-
6
-
7
-
8
-
9
-
10
-
11
-
12
-
13
-
14
-
15
-
16
-
17
-
18
-
19
-
20
-
21
-
22
-
23
-
24
-
25
-
26
-
27
-
28
-
29
-
30
-
31
-
32
-
33
-
34
-
35
-
 36
36 -
 37
37 -
 38
38 -
 39
39 -
 40
40 -
 41
41 -
 42
42 -
 43
43 -
 44
44 -
 45
45 -
 46
46 -
 47
47 -
 48
48 -
 49
49 -
 50
50 -
 51
51 -
 52
52 -
 53
53 -
 54
54 -
 55
55 -
 56
56 -
57
-
58
-
59
-
60
-
61
-
62
-
63
-
64
-
65
-
66
-
67
-
68
-
69
-
70
-
71
-
72
-
73
-
74
-
75
-
76
-
77
-
78
-
79
-
80
-
81
-
82
-
83
-
84
-
85
-
86
-
87
-
88
-
89
-
90
-
91
-
92
-
93
-
94
-
95
-
96
-
97
-
98
-
99
-
100
-
101
-
102
-
103
-
104
-
105
-
106
 |
 |

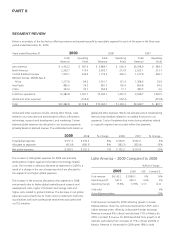
PART II
SEGMENT REVIEW
Below is an analysis of the key factors affecting revenue and operating profit by reportable segment for each of the years in the three-year
period ended December 31, 2009.
Years ended December 31 2009 2008 2007
Total
Revenue
Operating
Profit
Total
Revenue
Operating
Profit
Total
Revenue
Operating
Profit
Latin America $4,103.2 $647.9 $3,884.1 $690.3 $3,298.9 $483.1
North America 2,262.7 110.4 2,492.7 213.9 2,622.1 213.1
Central &Eastern Europe 1,500.1 244.9 1,719.5 346.2 1,577.8 296.1
Western Europe, Middle East &
Africa 1,277.8 84.2 1,351.7 121.0 1,308.6 33.9
Asia Pacific 885.6 74.2 891.2 102.4 850.8 64.3
China 353.4 20.1 350.9 17.7 280.5 2.0
Total from operations 10,382.8 1,181.7 10,690.1 1,491.5 9,938.7 1,092.5
Global and other expenses –(163.5) –(152.2) –(219.8)
Total $10,382.8 $1,018.2 $10,690.1 $1,339.3 $9,938.7 $872.7
Global and other expenses include, among other things, costs
related to our executive and administrative offices, information
technology, research and development, and marketing. Certain
planned global expenses are allocated to our business segments
primarily based on planned revenue. The unallocated costs remain as
global and other expenses. We do not allocatecosts of implementing
restructuring initiatives related to our global functions to our
segments. Costs of implementing restructuring initiatives related
to aspecific segment are recorded within that segment.
2009 2008 %Change 2008 2007 %Change
Total global expenses $577.3 $534.5 8% $534.5 $552.6 3%
Allocated to segments (413.8) (382.3) 8% (382.3) (332.8) 15%
Net global expenses $163.5 $152.2 7% $152.2 $219.8 31%
The increase in total global expenses for 2009 was primarily
attributable to higher legal and information technology related
costs. The increase in amounts allocated to segments for 2009 is a
result of achange in the mix of expenses which are allocated to
the segments and higher global expenses.
The increase in the amounts allocated to the segments in 2008
was primarily due to higher global marketing and research and
development costs, higher information technology costs and
higher costs related to global initiatives. The decrease in net global
expenses was primarily due to lower costs to implement restructur-
ing initiatives and lower professional service fees associated with
our PLS initiative.
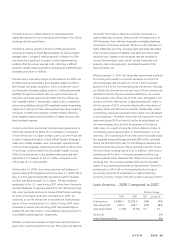
Latin America –2009 Compared to 2008
%/Point Change
2009 2008 US$ Constant $
Total revenue $4,103.2 $3,884.1 6% 16%
Operating profit 647.9 690.3 (6)% 2%
Operating margin 15.8% 17.8% (2.0) (2.0)
Units sold 6%
Active Representatives 10%
Total revenue increased for 2009 reflecting growth in Active
Representatives, driven by continued investments in RVP, and a
higher average order, offset by unfavorable foreign exchange.
Revenue increased 9% in Brazil and declined 11% in Mexico for
2009. Constant $revenue for 2009 benefited from growth in all
markets, particularly from increases of 17% in Brazil and 8% in
Mexico. Revenue in Venezuela for 2009 grew 18% in both