Avon 2009 Annual Report Download - page 50
Download and view the complete annual report
Please find page 50 of the 2009 Avon annual report below. You can navigate through the pages in the report by either clicking on the pages listed below, or by using the keyword search tool below to find specific information within the annual report.-
 1
1 -
2
-
3
-
4
-
5
-
6
-
7
-
8
-
9
-
10
-
11
-
12
-
13
-
14
-
15
-
16
-
17
-
18
-
19
-
20
-
21
-
22
-
23
-
24
-
25
-
26
-
27
-
28
-
29
-
30
-
31
-
32
-
33
-
34
-
35
-
36
-
37
-
38
-
39
-
 40
40 -
 41
41 -
 42
42 -
 43
43 -
 44
44 -
 45
45 -
 46
46 -
 47
47 -
 48
48 -
 49
49 -
 50
50 -
 51
51 -
 52
52 -
 53
53 -
 54
54 -
 55
55 -
 56
56 -
 57
57 -
 58
58 -
 59
59 -
 60
60 -
61
-
62
-
63
-
64
-
65
-
66
-
67
-
68
-
69
-
70
-
71
-
72
-
73
-
74
-
75
-
76
-
77
-
78
-
79
-
80
-
81
-
82
-
83
-
84
-
85
-
86
-
87
-
88
-
89
-
90
-
91
-
92
-
93
-
94
-
95
-
96
-
97
-
98
-
99
-
100
-
101
-
102
-
103
-
104
-
105
-
106
 |
 |

PART II
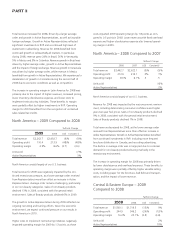
The decrease in operating margin for 2009 was primarily driven
by unfavorable foreign exchange, including the impacts of
foreign exchange transactions as well as translation, which
negatively impacted operating margin by an estimated 3points.
Additionally, higher costs to implement restructuring initiatives
negatively impacted operating margin by .7 points, as these costs
impacted 2009 operating margin by 2.5 points as compared to 1.8
points in 2008. Partially offsetting these unfavorable items were
lower overhead expenses in 2009.
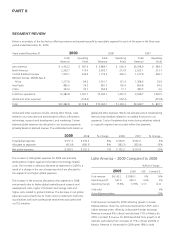
Western Europe, Middle East &Africa –
2008 Compared to 2007
%/Point Change
2008 2007 US$ Constant $
Total revenue $1,351.7 $1,308.6 3% 6%
Operating profit 121.0 33.9 **
Operating margin 8.9% 2.6% 6.3 6.8
Units sold (3)%
Active Representatives 4%
*Calculation not meaningful
Total revenue increased for 2008 due to growth in Active Repre-
sentatives and ahigher average order, partially offset by unfavor-
able foreign exchange. Revenue growth for 2008 was driven by
Italy and Turkey.
Revenue in the United Kingdom in 2008 declined 3% due to
unfavorable foreign exchange. Revenue in the United Kingdom
in Constant $increased, driven by an increase in Active Repre-
sentatives, benefiting from investments in representative recruit-
ing. Revenue in the United Kingdom also benefited from the
continued roll-out of PLS and strong merchandising. Revenue
growth in Turkey of 8% for 2008 was due to alarger average
order. Revenue in Turkey also benefited from continued high
levels of investments in advertising and RVP. Revenue in Italy in
2008 increased due to growth in Active Representatives.
The increase in operating margin for 2008 was primarily driven
by lower costs to implement restructuring initiatives, the impact
of higher revenue, lower inventory obsolescence expense, lower
overhead expenses and increased pricing. These benefits to oper-
ating margin were partially offset by the impact of unfavorable
foreign exchange on product cost and higher spending on RVP
and advertising.
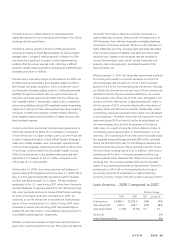
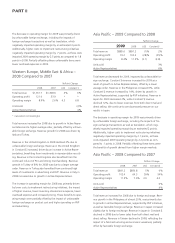
Asia Pacific –2009 Compared to 2008
%/Point Change
2009 2008 US$ Constant $
Total revenue $885.6 $891.2 (1)% 2%
Operating profit 74.2 102.4 (28)% (25)%
Operating margin 8.4% 11.5% (3.1) (2.8)
Units sold 3%
Active Representatives 6%
Total revenue decreased for 2009, impacted by unfavorable for-
eign exchange. Constant $revenue increased for 2009 as a
result of growth in Active Representatives, offset by alower
average order. Revenue in the Philippines increased 6%, while
Constant $revenue increased by 14%, driven by growth in
Active Representatives, supported by RVP initiatives. Revenue in
Japan for 2009 decreased 2%, while Constant $revenue
declined 12%, due to lower revenues from both direct mail and
direct selling. We continue to see downward pressure on our
results in Japan.
The decrease in operating margin for 2009 was primarily driven
by unfavorable foreign exchange, including the impacts of for-
eign exchange transactions as well as translation, which neg-
atively impacted operating margin by an estimated 2points.
Additionally, higher costs to implement restructuring initiatives
negatively impacted operating margin by 2.1 points, as these
costs impacted 2009 operating margin by 2.2 points as com-
pared to .1 points in 2008. Partially offsetting these items were
the benefits of growth derived from higher margin markets.
Asia Pacific –2008 Compared to 2007
%/Point Change
2008 2007 US$ Constant $
Total revenue $891.2 $850.8 5% 0%
Operating profit 102.4 64.3 59% 54%
Operating margin 11.5% 7.6% 3.9 4.0
Units sold 0%
Active Representatives 4%
Total revenue increased for 2008 due to foreign exchange. Reve-
nue growth in the Philippines of almost 20%, was primarily due
to growth in Active Representatives, supported by RVP initiatives,
as well as favorable foreign exchange. Revenue in Japan increased
slightly due to foreign exchange. Revenue in Japan in Constant $
declined in 2008 due to lower sales from both direct mail and
direct selling. Revenue in Taiwan declined in 2008, reflecting the
impact of afield restructuring and economic weakness, partially
offset by favorable foreign exchange.