Avon 2009 Annual Report Download - page 53
Download and view the complete annual report
Please find page 53 of the 2009 Avon annual report below. You can navigate through the pages in the report by either clicking on the pages listed below, or by using the keyword search tool below to find specific information within the annual report.-
 1
1 -
2
-
3
-
4
-
5
-
6
-
7
-
8
-
9
-
10
-
11
-
12
-
13
-
14
-
15
-
16
-
17
-
18
-
19
-
20
-
21
-
22
-
23
-
24
-
25
-
26
-
27
-
28
-
29
-
30
-
31
-
32
-
33
-
34
-
35
-
36
-
37
-
38
-
39
-
40
-
41
-
42
-
 43
43 -
 44
44 -
 45
45 -
 46
46 -
 47
47 -
 48
48 -
 49
49 -
 50
50 -
 51
51 -
 52
52 -
 53
53 -
 54
54 -
 55
55 -
 56
56 -
 57
57 -
 58
58 -
 59
59 -
 60
60 -
 61
61 -
 62
62 -
 63
63 -
64
-
65
-
66
-
67
-
68
-
69
-
70
-
71
-
72
-
73
-
74
-
75
-
76
-
77
-
78
-
79
-
80
-
81
-
82
-
83
-
84
-
85
-
86
-
87
-
88
-
89
-
90
-
91
-
92
-
93
-
94
-
95
-
96
-
97
-
98
-
99
-
100
-
101
-
102
-
103
-
104
-
105
-
106
 |
 |

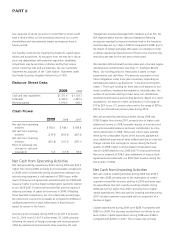
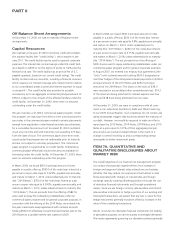
driven by capital spending in 2008 for the construction of new
distribution facilities in North America and Latin America, and
information systems (including the continued development of the
ERP system). Capital expenditures in 2010 are currently expected
to be approximately $350 and will be funded by cash from oper-
ations. These expenditures will include investments for capacity
expansion, modernization of existing facilities, continued con-
struction of new distribution facilities in Latin America and
information systems.
Net Cash from Financing Activities
Net cash used by financing activities of $361.8 during 2009,
compared unfavorably to cash used by financing activities of
$141.5 during 2008. During 2009, we repaid $958.5 of commer-
cial paper and other debt as compared to $290.8 during 2008. In
2009, we received proceeds from the $850 debt issuance during
March 2009 as compared to a$500 debt issuance during 2008.
Additionally, during 2009 we repurchased $8.6 of common stock
as compared to $172.1 in 2008.
Net cash used by financing activities during 2008 was $455.6
lower than during 2007, primarily due to lower repurchases of
common stock during 2008.
We purchased approximately .4 million shares of our common
stock for $8.6 during 2009, as compared to 4.6 million shares for
$172.1 during 2008 and 17.3 million shares for $666.8 during
2007, under our previously announced share repurchase programs
and through acquisition of stock from employees in connection
with tax payments upon vesting of restricted stock units. In Octo-
ber 2007, the Board of Directors authorized the repurchase of
$2,000.0 of our common stock over afive-year period, which
began in December 2007.
We increased our quarterly dividend payments to $.21 per share in
2009 from $.20 per share in 2008. In February 2010, our Board
approved an increase in the quarterly dividend to $.22 per share.
Debt and Contractual Financial Obligations and Commitments
At December 31, 2009, our debt and contractual financial obligations and commitments by due dates were as follows:
2010 2011 2012 2013 2014
2015 and
Beyond Total
Short-term debt $122.8 $– $– $– $– $– $122.8
Long-term debt –500.0 –375.0 500.0 850.0 2,225.0
Capital lease obligations15.3 11.6 12.2 5.5 5.6 37.2 87.4
Total debt 138.1 511.6 12.2 380.5 505.6 887.2 2,435.2
Debt-related interest 122.5 97.6 96.2 82.2 54.4 53.7 506.6
Total debt-related 260.6 609.2 108.4 462.7 560.0 940.9 2,941.8
Operating leases92.1 63.9 47.1 21.7 15.8 37.7 278.3
Purchase obligations 163.5 70.0 59.0 38.3 34.8 17.5 383.1
Benefit obligations (1) 53.4 11.4 11.7 10.3 9.7 66.4 162.9
Total debt and contractual
financial obligations and
commitments (2) $569.6 $754.5 $226.2 $533.0 $620.3 $1,062.5$3,766.1
(1) Amounts represent expectedfuture benefit payments for our unfunded pension and postretirement benefit plans, as well as expected contributions for 2010
to our funded pension benefit plans.
(2) The amount of debt and contractual financial obligations and commitments excludes amounts due under derivative transactions. The table also excludes
information on recurring purchases of inventory as these purchase orders are non-binding, are generally consistent from year to year, and are short-term in
nature. The table does not include any reserves for income taxes because we are unable to reasonably predict the ultimate amount or timing of settlement of
our reserves for income taxes. At December 31, 2009, our reserves for income taxes, including interest and penalties, totaled $133.4.
See Note 4, Debt and Other Financing, and Note 13, Leases and Commitments, to our 2009 Annual Report for further information on our
debt and contractual financial obligations and commitments. Additionally, as disclosed in Note 14, Restructuring Initiatives, we have a
remaining liability of $149.1 at December 31, 2009, associated with the restructuring charges recorded to date under the 2005 and 2009
Restructuring Programs, and we also expect to record additional restructuring charges of $20.9 in future periods to implement the actions
approved to date. The significant majority of these liabilities will require cash payments during 2010.
AVON2009 35